. 2013 Oct;83(10):898-912.
doi: 10.1002/cyto.a.22340. Epub 2013 Aug 8.

Assessing FRET using spectral techniques

Affiliations

Assessing FRET using spectral techniques

Silas J Leavesley et al. Cytometry A. 2013 Oct.

Abstract

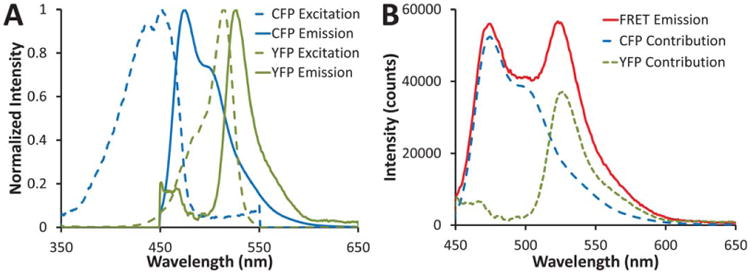
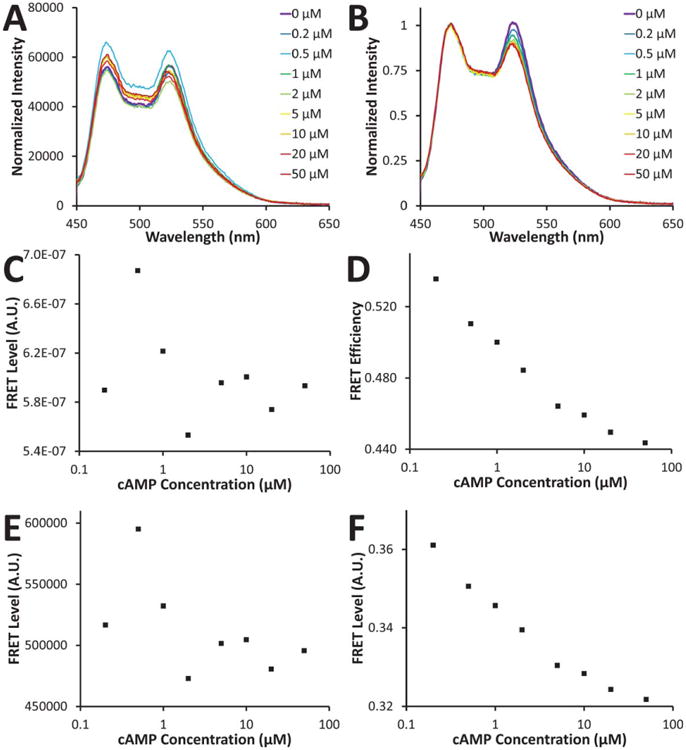
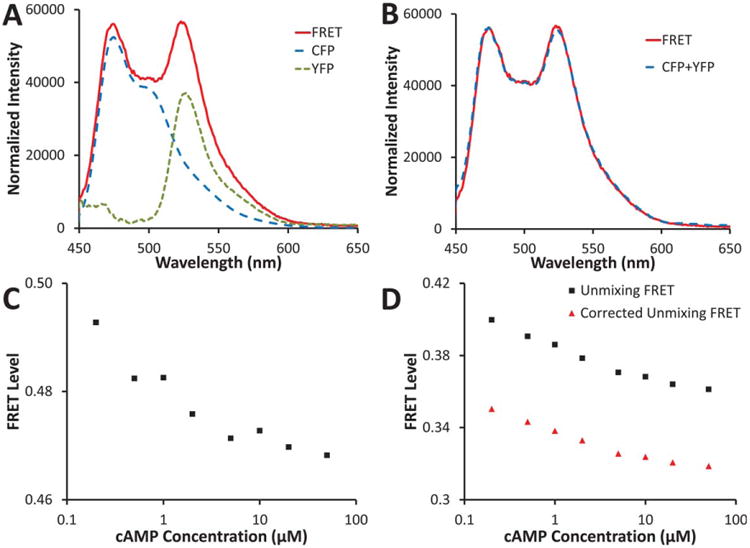
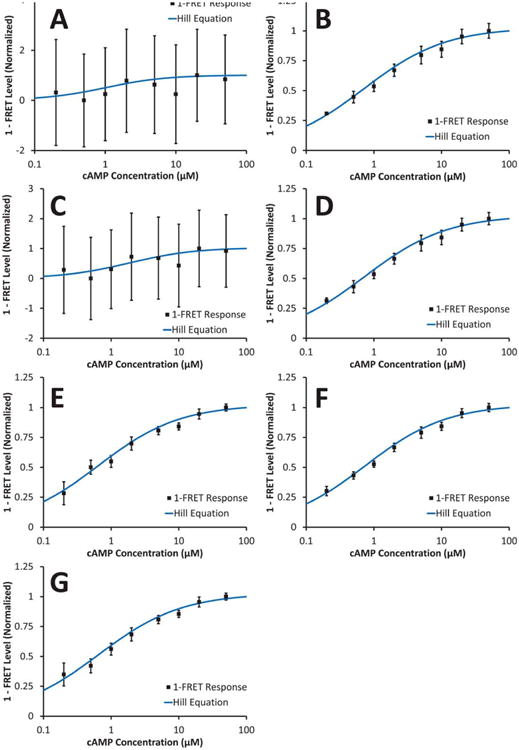
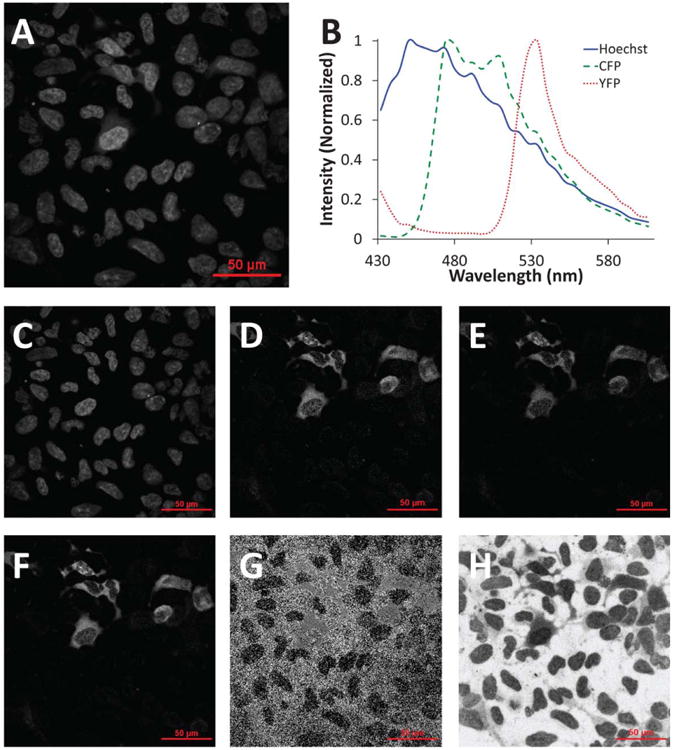
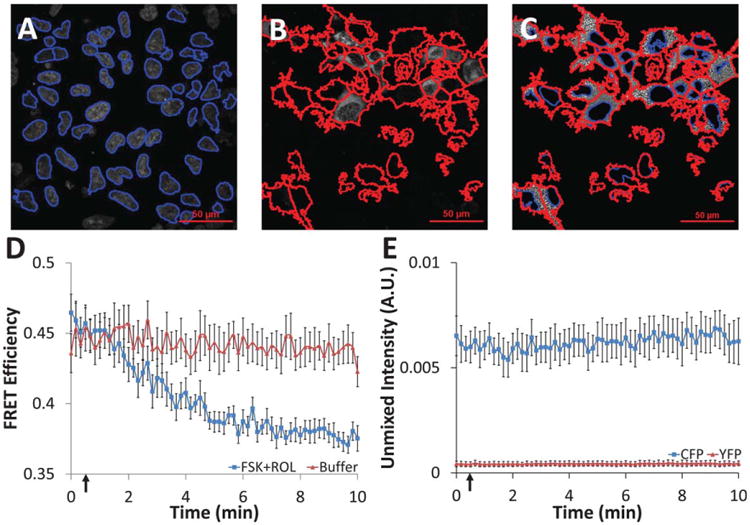
Förster resonance energy transfer (FRET) techniques have proven invaluable for probing the complex nature of protein-protein interactions, protein folding, and intracellular signaling events. These techniques have traditionally been implemented with the use of one or more fluorescence band-pass filters, either as fluorescence microscopy filter cubes, or as dichroic mirrors and band-pass filters in flow cytometry. In addition, new approaches for measuring FRET, such as fluorescence lifetime and acceptor photobleaching, have been developed. Hyperspectral techniques for imaging and flow cytometry have also shown to be promising for performing FRET measurements. In this study, we have compared traditional (filter-based) FRET approaches to three spectral-based approaches: the ratio of acceptor-to-donor peak emission, linear spectral unmixing, and linear spectral unmixing with a correction for direct acceptor excitation. All methods are estimates of FRET efficiency, except for one-filter set and three-filter set FRET indices, which are included for consistency with prior literature. In the first part of this study, spectrofluorimetric data were collected from a CFP-Epac-YFP FRET probe that has been used for intracellular cAMP measurements. All comparisons were performed using the same spectrofluorimetric datasets as input data, to provide a relevant comparison. Linear spectral unmixing resulted in measurements with the lowest coefficient of variation (0.10) as well as accurate fits using the Hill equation. FRET efficiency methods produced coefficients of variation of less than 0.20, while FRET indices produced coefficients of variation greater than 8.00. These results demonstrate that spectral FRET measurements provide improved response over standard, filter-based measurements. Using spectral approaches, single-cell measurements were conducted through hyperspectral confocal microscopy, linear unmixing, and cell segmentation with quantitative image analysis. Results from these studies confirmed that spectral imaging is effective for measuring subcellular, time-dependent FRET dynamics and that additional fluorescent signals can be readily separated from FRET signals, enabling multilabel studies of molecular interactions. © 2013 International Society for Advancement of Cytometry.

Keywords: CFP; Epac; YFP; cAMP; flow cytometry; hyperspectral; imaging; microscopy; spectroscopy.


Conflict of interest statement

The authors have no conflict of interest to declare.

Figures

Figure 1
Figure 1
A: Excitation (dashed lines) and emission (solid lines) spectra of CFP (blue) and YFP (green), normalized to the peak intensity value. B: A typical FRET emission spectrum (red solid line) with the estimated CFP (blue long-dash line) and YFP (green short-dash line) contributions indicated. [Color figure can be viewed in the online issue, which is available at wileyonlinelibrary.com]
Figure 2
Figure 2
A: cAMP dose-dependence of FRET emission; B: the same data normalized to the CFP emission peak (473 nm); C: FRET response calculated using a one filter set method; D: FRET response calculated using a two filter set method; E: FRET response calculated using a three filter set method; F: FRET response calculated using a three filter set method and corrected for changes in CFP concentration. Note that panels C and E represent FRET indices, whereas panels D and F represent FRET efficiencies. Normalized FRET responses are shown in Figure 4. [Color figure can be viewed in the online issue, which is available at wileyonlinelibrary.com]
Figure 3
Figure 3
A: FRET spectrum (red solid line) for basal (0 μM) cAMP from Figure 2 showing estimated contributions of CFP (long-dash blue line) and YFP (short-dash green line) calculated using linear unmixing; B: the sum of the estimated CFP and YFP contributions (dashed blue line) very closely matches the FRET spectrum from A (solid red line); C: FRET efficiency calculated using the CFP peak intensity (473 nm) and the YFP peak intensity (525 nm); D: FRET efficiency calculated by linear unmixing, as shown in A, and dividing the CFP abundance by the CFP+YFP abundance (black squares); the linear unmixing FRET has been further corrected by estimating the percent of the acceptor signal that is due to direct excitation and then subtracting this percent from the total acceptor signal before dividing by the donor signal (red triangles), as shown in Eq. (13). Normalized FRET responses are shown in Figure 4. [Color figure can be viewed in the online issue which is available at wileyonlinelibrary.com]
Figure 4
Figure 4
1-FRET response normalized to minimum and maximum FRET levels. Error bars indicate the standard error-of-the-mean (n = 3) for each cAMP concentration. A: one-filter set method; B: two-filter set method; C: three-filter set method; D: three-filter set method and corrected for changes in CFP concentration; E: YFP-CFP peak intensity ratio; F: linear unmixing YFP-CFP ratio; G: linear unmixing YFP-CFP ratio, corrected for direct excitation of YFP. Note that panels A and C represent FRET indices, whereas panels B, D, E, F, and G represent FRET efficiencies. [Color figure can be viewed in the online issue, which is available at wileyonlinelibrary.com]
Figure 5
Figure 5
Hyperspectral confocal microscope images were unmixed to calculate fluorophore intensities and the FRET efficiency. A: Raw hyperspectral confocal microscope image (all wavelength bands summed) of HEK-293 cells expressing the CFP-Epac-YFP probe; B: the spectral library used for linear unmixing; nonnegatively constrained linear unmixing was used to calculate images for C: Hoechst, D: CFP, and E: YFP; F: the unmixed CFP and YFP images were summed to locate expressing (transfected) cells; G: the FRET efficiency was calculated using equation 23 (note that this image was later masked so that only regions with sufficient signal were used for single-cell FRET calculations, as shown in Figure 6); H: the root-mean-square (RMS) percent error associated with linear unmixing was calculated as the RMS residual from unmixing divided by the RMS signal of the original spectral image. [Color figure can be viewed in the online issue which is available at wileyonlinelibrary.com]
Figure 6
Figure 6
Single-cell time course data were extracted from unmixed hyperspectral confocal images using feature identification and quantification in Cell Profiler software. A: All nuclei were first identified from the unmixed Hoechst image (nuclei outlines shown in blue); B: nuclei within expressing cells were expanded to identify expressing cell borders (cell outlines shown in red); C: the area between nuclei and cell borders was labeled as expressing cell cytoplasm (nuclei shown in blue, cell borders in red, grayscale values represent FRET efficiency); mean intensity values were measured on a per-cell basis for cytoplasm regions with a solidity ≥0.4; D: administration of 10 μM forskolin (adenylyl cyclase activator) and 10 μM rolipram (phosphodiesterase inhibitor) at 30 seconds (indicated by arrow) resulted in the expected increase in cytosolic cAMP and a subsequent decrease in cytosolic FRET efficiency for cells expressing the CFP-Epac-YFP probe, while cells treated with buffer had displayed no change (average of all cells in each field of view, n = 8 fields of view, error bars are the standard error of the mean); E: CFP and YFP controls showed nonsignificant photobleaching over the time course of the experiment (average of all cells in each field of view, n = 5 fields of view, error bars are the standard error of the mean).

Comment in

References

    1. Gordon GW, Berry G, Liang XH, Levine B, Herman B. Quantitative fluorescence resonance energy transfer measurements using fluorescence microscopy. Biophys J. 1998;74:2702–2713. - PMC - PubMed
    1. Berney C, Danuser G. FRETor no FRET: A quantitative comparison. Biophys J. 2003;84:3992–4010. - PMC - PubMed
    1. Sun Y, Hays NM, Periasamy A, Davidson MW, Day RN. Monitoring protein interactions in living cells with fluorescence lifetime imaging microscopy. Imaging and Spectroscopic Analysis of Living Cells: Optical and Spectroscopic Techniques. 2012:371. - PMC - PubMed
    1. Gu Y, Di W, Kelsell D, Zicha D. Quantitative fluorescence resonance energy transfer (FRET) measurement with acceptor photobleaching and spectral unmixing. J Microsc. 2004;215:162–173. - PubMed
    1. Elangovan M, Wallrabe H, Chen Y, Day RN, Barroso M, Periasamy A. Characterization of one-and two-photon excitation fluorescence resonance energy transfer microscopy. Methods. 2003;29:58–73. - PubMed

Publication types

MeSH terms