

doi: 10.1126/science.1237150.
Spatial dynamics of chromosome translocations in living cells
Affiliations
- PMID: 23929981
- PMCID: PMC6324928
- DOI: 10.1126/science.1237150
Item in Clipboard
Spatial dynamics of chromosome translocations in living cells
Science.
.
Abstract
Chromosome translocations are a hallmark of cancer cells. We have developed an experimental system to visualize the formation of translocations in living cells and apply it to characterize the spatial and dynamic properties of translocation formation. We demonstrate that translocations form within hours of the occurrence of double-strand breaks (DSBs) and that their formation is cell cycle-independent. Translocations form preferentially between prepositioned genome elements, and perturbation of key factors of the DNA repair machinery uncouples DSB pairing from translocation formation. These observations generate a spatiotemporal framework for the formation of translocations in living cells.
Figures

(A) NIH3T3duo cells containing an integrated LacO- IScel array and three TetO-IScel-TetO arrays, stably expressing GFP-LacR and mCherry-TetR, respectively. Scale bar, 10 μm. (B) Colocalization of LacO (green) and TetO (red) arrays in NIH3T3duo cells 24 hours after expression of IScel. Scale bar, 10 μm. (C) Percentages of the cells with paired LacO and TetO arrays in indicated cell populations. Values represent means ± SD from at least three independent experiments (7500 to 16,500 cells with LacO and TetO analyzed per sample; *P < 0.05, **P < 0.001, ***P < 0.0001, Student t test or χ2 test). (D) Real-time PCR analysis for detection of Lac-Tet translocations in NIH3T3duo cells transfected with ISceI or ISceID44A for the indi cated times. PCR was performed using primers located in the Lac orTet operator sequences. Standard curve was generated by spiking-in at the indi cated ratios with NIH2/4 cells, which contain an integrated LacO-IsceI-TetO array (4). Values are normalized to 1:2000 sample and represent means ± SD from three independent experiments. *P < 0.05, ***P < 0.0001, two-tailed Student t test. (E) Untreated cells or cells transfected for 24 hours with the indicated plasmids were fixed and stained with DAPI and uHTI was performed to assess the cell cycle status of individual cells (fi g. S3, A and B). The percentage of cells with paired LacO- TetO arrays was determined. Values represent means ± SD from three independent experiments; one-way analysis of variance (ANOVA) test or χ2 test (ISceI positive: G1, n = 3620; S, n = 985; G2+M, n = 1295; ISceID44A positive: Gi, n = 1851; S, n = 1052; G2+M, n = 891). (F) NIH3T3duo cells transfected for 24 hours with ISceI were stained with DAPI and sorted into G1 or S+G2+M populations (fig. S3E). Identical numbers of gated G1, S+G2+M, and asynchronous cells were used to extract DNA and perform real-time PCR. Values represent means ± SD from two independent experiments (P > 0.05, one-way ANOVA). (G) Real-time PCR for LacO-TetO translocations in NIH3T3duo cells transfected with ISceI for 24 hours and arrested in G1 phase by contact inhibition or at the G2/M boundary by treatment with nocodazole (fig. S3, A and F). Values represent means ± SD from three experiments (P > 0.05, one-way ANOVA).
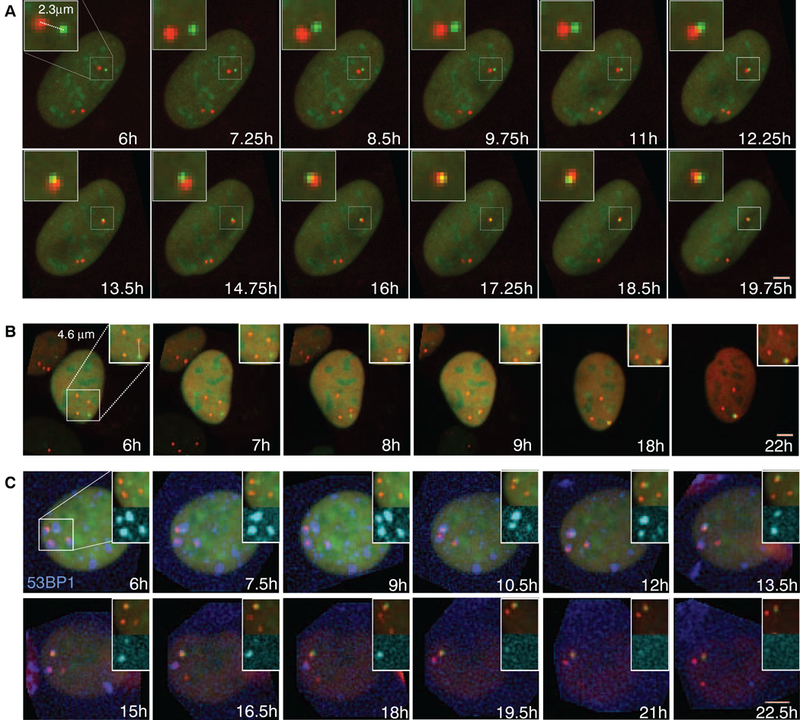
(A and B) Time-lapse microscopy of NIH3T3duo cells transfected with IScel. Maximal projected image sequences of representative movies show pairing of (A) proximal and (B) distal DSBs. Scale bars, 5 μm.(C) Formation of LacO (green)-TetO (red) translocation relative ot repair foci in NIH3T3 duo cells stably expressing BFP-53BFP1 (blue). Scale bar, 5 μm.
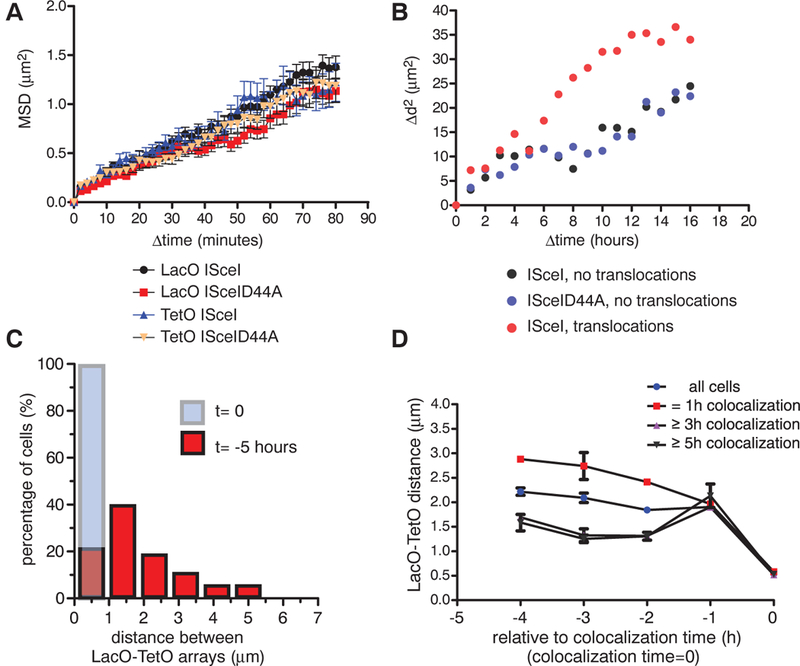
(A) Mean squared displacement (MSD) plots for LacO and TetO in cells transfected with ISceI or ISceID44A. Values represent means ± SEM of pooled data from three independent experiments (n = 66 to 98). (B) Mean squared change in distance (Δd2) between the LacO and the closest TetO array of cells with intact arrays (ISceID44A, n = 34), DSBs without pairing events (ISceI, n = 33), or persistent colocalization (ISceI, pairing ≥3 hours, n = 43). (C) Translocations occur predominantly from proximally located DSBs. Persistent LacO-TetO pairs (≥3 hours) were identified, and distance histograms between LacO and TetO arrays for the time of pairing (t = 0, light blue bar) and 5 hours before (t = −5 hours, red bars) were generated (n = 40). (D) Average LacO- TetO distances as a function of time before pairing for 1 hour, ≥3 hours, and ≥5 hours (all tracks, n = 2897; 1-hour transient interaction, n = 1437; at least 3 hours, n = 615; 5-hour pairing, n = 157). Values represent means ± SD from two independent experiments.
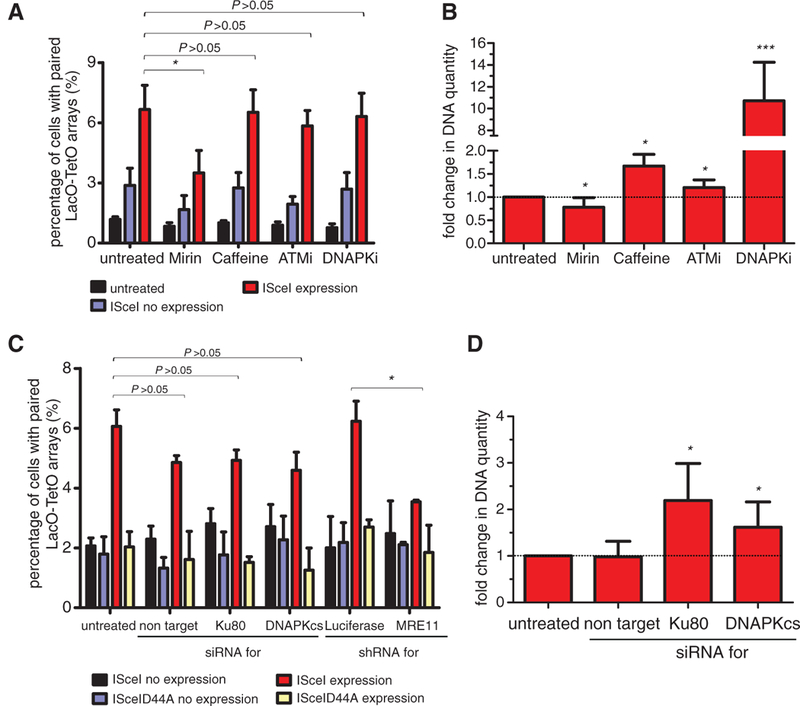
(A) The percentage of NIH3T3duo cells with paired LacO-TetO arrays was assessed after ISceI or ISceID44A expression for 24 hours in the presence of the indicated inhibitors. Values represent means ± SD from at least four independent experiments (Student t test or χ2 test, *P < 0.05). (B) Real-time PCR on DNA from cells transfected with ISceI for 24 hours in the presence of the indicated inhibitors. The untreated sample was used as a control. Values represent means ± SD from at least four independent experiments (Student t test, *P < 0.05, ***P < 0.0001). (C) Percentage of cells with paired LacO-TetO arrays in cells treated with the indicated siRNAs or shRNAs as in (A) (Student t test, *P < 0.05). Values represent means ± SD from at least two independent experiments. (D) Real-time PCR of NIH3T3- duo cells treated with the indicated siRNAs performed as in (B) (Student t test, *P < 0.05).
References
-
- Mitelman F, Johansson B, Mertens F, Nat. Rev. Cancer 7, 233–245 (2007). - PubMed
Publication types
MeSH terms
Substances
Grants and funding
LinkOut - more resources
Full Text Sources
Other Literature Sources
Research Materials
