

The relationship between air pollution and low birth weight: effects by mother's age, infant sex, co-pollutants, and pre-term births
- PMID: 23930137
- PMCID: PMC3735236
- DOI: 10.1088/1748-9326/3/4/044003
The relationship between air pollution and low birth weight: effects by mother's age, infant sex, co-pollutants, and pre-term births
Abstract
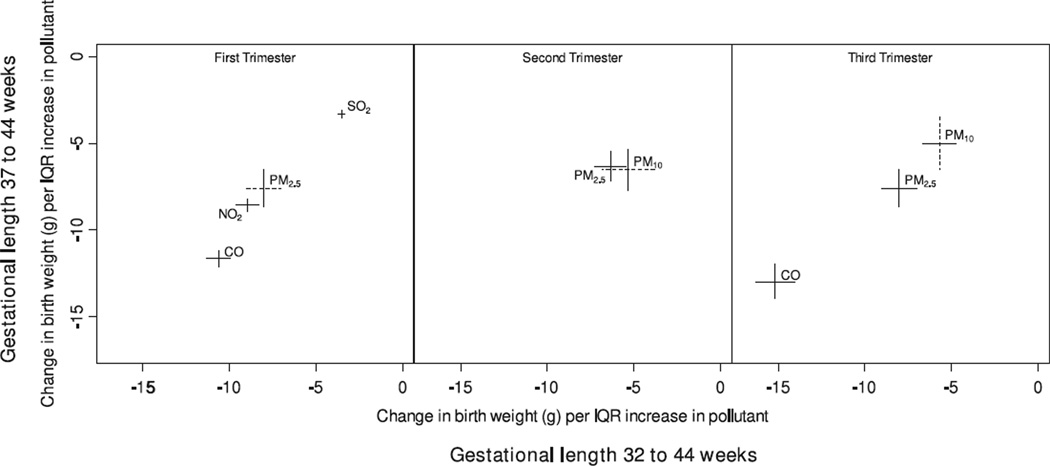
Previously we identified associations between the mother's air pollution exposure and birth weight for births in Connecticut and Massachusetts from 1999-2002. Other studies also found effects, though results are inconsistent. We explored potential uncertainties in earlier work and further explored associations between air pollution and birth weight for PM10, PM2.5, CO, NO2, and SO2. Specifically we investigated: (1) whether infants of younger (≤24 years) and older (≥40 years) mothers are particularly susceptible to air pollution's effects on birth weight; (2) whether the relationship between air pollution and birth weight differed by infant sex; (3) confounding by co-pollutants and differences in pollutants' measurement frequencies; and (4) whether observed associations were influenced by inclusion of pre-term births. Findings did not indicate higher susceptibility to the relationship between air pollution and birth weight based on the mother's age or the infant's sex. Results were robust to exclusion of pre-term infants and co-pollutant adjustment, although sample size decreased for some pollutant pairs. These findings provide additional evidence for the relationship between air pollution and birth weight, and do not identify susceptible sub-populations based on infant sex or mother's age. We conclude with discussion of key challenges in research on air pollution and pregnancy outcomes.
Keywords: PM10; PM2.5; air pollution; birth weight; carbon monoxide; nitrogen dioxide; particulate matter; pregnancy; sensitivity analysis; sulfur dioxide.
Figures


References
-
- Basu R, Woodruff TJ, Parker JD, Saulnier L, Schoendorf KC. Comparing exposure metrics in the relationship between PM2.5 and birth weight in California. J. Expo. Anal. Environ. Epidemiol. 2004;14:391–396. - PubMed
-
- Bell ML. The use of ambient air quality modeling to estimate individual and population exposure for human health research: a case study of ozone in the Northern Georgia region of the United States. Environ. Int. 2006;32:586–593. - PubMed
Grants and funding
LinkOut - more resources
Full Text Sources