. 2013 Aug 6;105(3):581-92.
doi: 10.1016/j.bpj.2013.06.027.

Determinants of maximal force transmission in a motor-clutch model of cell traction in a compliant microenvironment

Affiliations

Determinants of maximal force transmission in a motor-clutch model of cell traction in a compliant microenvironment

Benjamin L Bangasser et al. Biophys J. .

Abstract

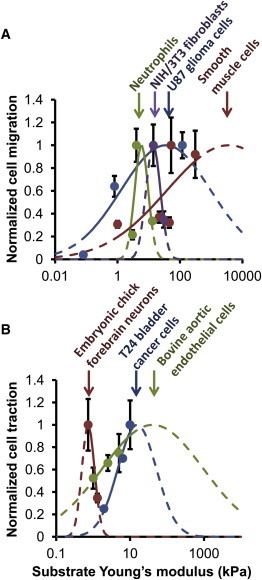
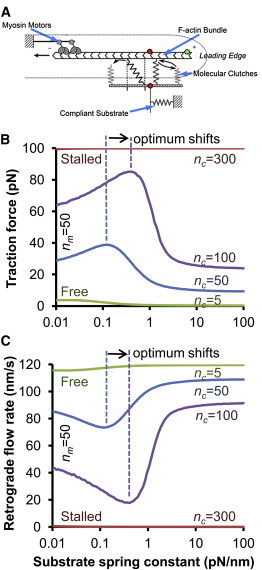
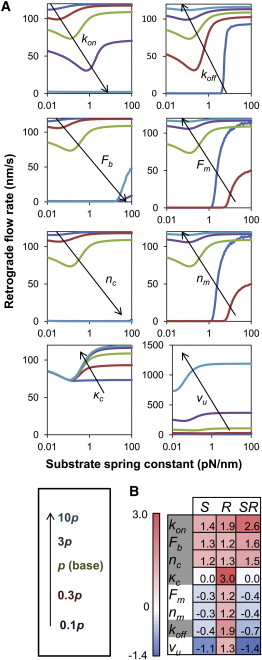
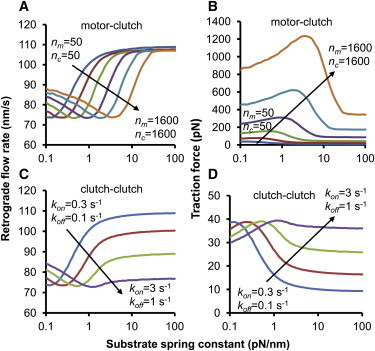
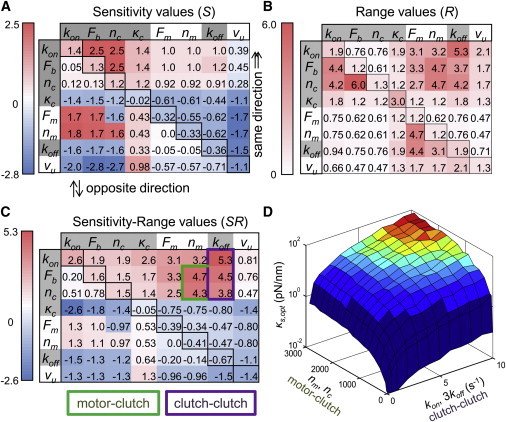
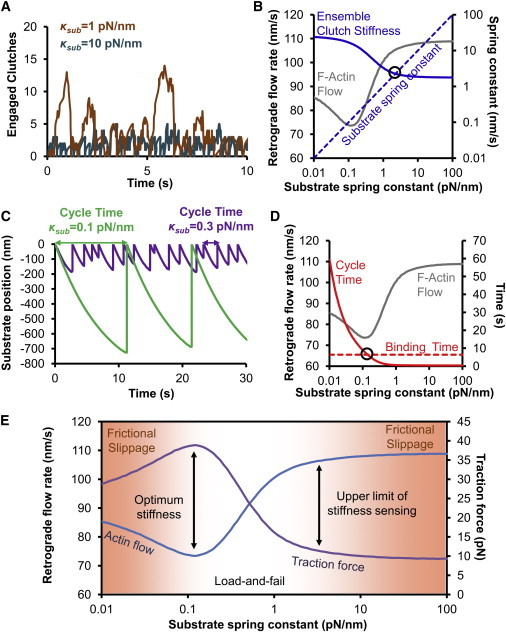
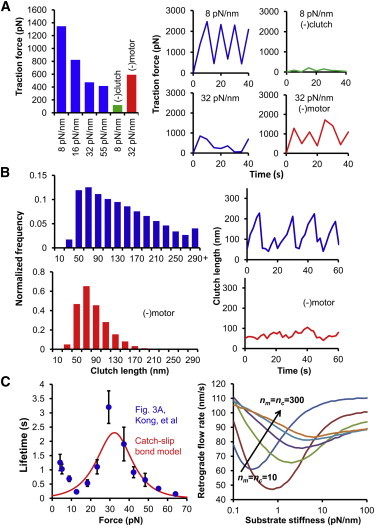
The mechanical stiffness of a cell's environment exerts a strong, but variable, influence on cell behavior and fate. For example, different cell types cultured on compliant substrates have opposite trends of cell migration and traction as a function of substrate stiffness. Here, we describe how a motor-clutch model of cell traction, which exhibits a maximum in traction force with respect to substrate stiffness, may provide a mechanistic basis for understanding how cells are tuned to sense the stiffness of specific microenvironments. We find that the optimal stiffness is generally more sensitive to clutch parameters than to motor parameters, but that single parameter changes are generally only effective over a small range of values. By contrast, dual parameter changes, such as coordinately increasing the numbers of both motors and clutches offer a larger dynamic range for tuning the optimum. The model exhibits distinct regimes: at high substrate stiffness, clutches quickly build force and fail (so-called frictional slippage), whereas at low substrate stiffness, clutches fail spontaneously before the motors can load the substrate appreciably (a second regime of frictional slippage). Between the two extremes, we find the maximum traction force, which occurs when the substrate load-and-fail cycle time equals the expected time for all clutches to bind. At this stiffness, clutches are used to their fullest extent, and motors are therefore resisted to their fullest extent. The analysis suggests that coordinate parameter shifts, such as increasing the numbers of motors and clutches, could underlie tumor progression and collective cell migration.


Figures

Figure 1
Figure 1
Experimental evidence for shifting stiffness optima. (A) Cell migration data for neutrophils (10), NIH/3T3 fibroblasts (2), U87 glioma cells (4), and smooth muscle cells (11) show varying dependence on stiffness. For U87 glioma cells and smooth muscle cells, experimentally measured migration increases with substrate stiffness. For NIH/3T3 fibroblasts it decreases with stiffness, and for neutrophils it increases and then decreases with stiffness. These results suggest a biphasic dependence of cell migration on substrate stiffness; therefore, Gaussian curves were fit to the data to show potential stiffness optima. (B) Traction force data for embryonic chick forebrain neurons (15), T24 bladder cancer cells (7), and bovine aortic endothelial cells (12) also show varying dependence on substrate stiffness. For embryonic chick forebrain neurons, traction force decreases with stiffness, whereas for T24 bladder cancer cells and bovine aortic endothelial cells it increases with stiffness. This also suggests a biphasic response, and Gaussian curves were fit to the data to show potential stiffness optima. For both A and B, data were normalized to the maximum value for the particular cell type, therefore all data can be shown easily on one plot. Dashed lines indicate extrapolation of the Gaussian curves beyond the given data.
Figure 2
Figure 2
Motor-clutch model for cell traction force. (A) The motor-clutch model describes the adhesion and traction generation of a cellular protrusion (15). Briefly, molecular motors generate forces on the F-actin cytoskeleton that are resisted by molecular clutch bonds that transmit forces to a compliant substrate external to the cell. (B and C) Changing the number of clutches changes the shape of the model output traction force and F-actin retrograde flow rate. Increasing clutches from nc = 50 to nc = 100 shifts the traction force maximum and the retrograde flow minimum to the right toward higher stiffness. The traction force maximum corresponds to the retrograde flow minimum. Increasing clutches to nc = 300 results in a stalled system, whereas decreasing clutches to nc = 5 results in a free flowing system. (A used with permission of the American Association for the Advancement of Science (AAAS)).
Figure 3
Figure 3
Single-parameter sensitivity. (A) All model parameters affect the shape of the F-actin retrograde flow rate as a function of substrate stiffness. Plots are shown for 0.1, 0.3, 1, 3, and 10 times the base parameter value. (B) The eight parameters have varying sensitivity and range values. The parameters are ranked from strongest positive (red) to strongest negative (blue) sensitivity-range (SR) value. Clutch parameters are highlighted in gray.
Figure 4
Figure 4
Shifting the optimum by coordinate parameter changes. (A) The minimum in F-actin retrograde flow shifts with coordinate changes in the number of motors and the number of clutches (i.e., motor-clutch parameter changes). (B) The traction force maximum also increases as both motors and clutches increase because the number of motors is increasing. (C) The F-actin retrograde flow rate minimum also shifts with changes in kon and koff, but the shape of the curve is not maintained. In this case of coordinate increase in kon and koff (i.e., clutch-clutch parameter changes), the maximum traction force remains constant because the number of motors is unchanged.
Figure 5
Figure 5
Systematic pairwise parameter sensitivity analysis. (A) Sensitivity values were calculated for each parameter combination. The diagonal corresponds to the single parameter sensitivities, whereas the entries above the diagonal correspond to dual parameter changes in the same direction (i.e., both parameters increase and both parameters decrease). Entries below the diagonal correspond to dual parameter changes in opposite directions (i.e., one parameter increases and the other decreases). Entries are color-coded based on the sensitivity value (S), as previously described by Gaudet et al. (52). (B) The range values (R) of each parameter set were also calculated for all pairwise combinations. Again, the diagonal corresponds to the single parameter ranges, and above and below the diagonal correspond to parameter changes in the same and opposite directions. (C) The product of sensitivity and range, which we call sensitivity-range (SR) is given for all pairwise combinations. The same convention for changes above and below the diagonal is used for SR as for R. Clutch-clutch and motor-clutch parameter changes that shift the optimum to the greatest extent are highlighted. Clutch parameters are highlighted in gray. (D) Combination of the strongest pairwise interactions can extend the SR even further. An example of changing four parameters is shown where the surface signifies the optimal stiffness when changing the numbers of motors and clutches, nm and nc, and the kinetic rate constants, kon and koff coordinately. The ratios of nm/nc and kon/koff are maintained at 1 and 3, respectively.
Figure 6
Figure 6
Key determinants of stiffness sensitivity and the optimal stiffness. (A) The number of clutches engaged increases with decreasing substrate stiffness. On soft substrates, it takes longer for forces to build on the clutch bonds, thereby decreasing the rate at which clutch bonds break. The result is an increased number of clutches engaged on average on softer substrates. (B) The upper limit of stiffness sensing occurs when the ensemble clutch stiffness (mean number of engaged clutches multiplied by the individual clutch stiffness) equals the substrate stiffness. At substrate stiffness greater than this crossover point, the ensemble clutch stiffness is the softer of the two springs in series, and the system is insensitive to stiffness changes in the environment. At substrate stiffness below this crossover point, the ensemble clutch stiffness exceeds the substrate stiffness, and the system responds to mechanical changes in the environment. (C) The load-and-fail cycle time near the optimal stiffness increases with decreasing substrate stiffness. On soft substrates, it takes longer to reach the load required to ensure collective failure of the clutch bonds. (D) The optimal stiffness occurs when the clutch binding time (see Eq. 10) equals the load-and-fail cycle time. At substrate stiffness above this crossover point, it is expected that not all of the clutches will engage during one loading cycle, whereas at substrate stiffness below this crossover point, all clutches can engage. Further decreases of substrate stiffness lead to even longer cycle times, and spontaneous low-load individual clutch failure before collective failure leads to a regime of frictional slippage at low substrate stiffness. (E) The model predicts three regimes of stiffness sensing. There are two regions of frictional slippage, one below the optimal stiffness on soft substrates, and one above the upper limit of stiffness sensing on stiff substrates. Between these two regimes, the cycle time is long enough for load-and-fail to occur, but short enough to prevent spontaneous bond rupture. This is the regime of load-and-fail without frictional slippage.
Figure 7
Figure 7
Experimental validation of the motor-clutch model. (A) As in Plotnikov et al. (30), the motor-clutch model produces either fluctuating or stable traction forces depending on the conditions. Parameters were adjusted to show decreasing traction force on substrate stiffnesses ranging from 8 to 55 pN/nm. Over this range the traction dynamics also shifted from fluctuating traction to stable traction (blue). Reduction of the number of clutches on 8 pN/nm resulted in stable traction (green), whereas reduction of the number of motors on 32 pN/nm resulted in fluctuating traction (red). (B) Clutch extension histograms and dynamics show behavior similar to that seen in Margadant et al. (31). Clutch length shows a broad distribution from 10 to >290 nm, whereas individual clutch length cycles through time (blue). Reduction of the number of motors shifts the length distribution to lower values, and the individual clutch length remains relatively constant (red). (C) A catch-slip bond model was fit to integrin catch bond data from Kong et al. (32). The fitted catch-slip bond model was incorporated into the motor-clutch model to produce qualitatively similar results to the simplified slip bond motor-clutch model. The catch-slip bond model produces a minimum in actin retrograde flow with respect to substrate stiffness, and this minimum can be shifted by coordinately changing the number of motors and clutches.

References

    1. Nemir S., West J.L. Synthetic materials in the study of cell response to substrate rigidity. Ann. Biomed. Eng. 2010;38:2–20. - PubMed
    1. Lo C.-M., Wang H.-B., Wang Y.-L. Cell movement is guided by the rigidity of the substrate. Biophys. J. 2000;79:144–152. - PMC - PubMed
    1. Engler A.J., Sen S., Discher D.E. Matrix elasticity directs stem cell lineage specification. Cell. 2006;126:677–689. - PubMed
    1. Ulrich T.A., de Juan Pardo E.M., Kumar S. The mechanical rigidity of the extracellular matrix regulates the structure, motility, and proliferation of glioma cells. Cancer Res. 2009;69:4167–4174. - PMC - PubMed
    1. Isenberg B.C., Dimilla P.A., Wong J.Y. Vascular smooth muscle cell durotaxis depends on substrate stiffness gradient strength. Biophys. J. 2009;97:1313–1322. - PMC - PubMed

Publication types

LinkOut - more resources