

Diagnostic accuracy of diffusion tensor imaging in amyotrophic lateral sclerosis: a systematic review and individual patient data meta-analysis
- PMID: 23931423
- PMCID: PMC4384461
- DOI: 10.1016/j.acra.2013.03.017
Diagnostic accuracy of diffusion tensor imaging in amyotrophic lateral sclerosis: a systematic review and individual patient data meta-analysis
Abstract
Rationale and objectives: There have been a large number of case-control studies using diffusion tensor imaging (DTI) in amyotrophic lateral sclerosis (ALS). The objective of this study was to perform an individual patient data (IPD) meta-analysis for the estimation of the diagnostic accuracy measures of DTI in the diagnosis of ALS using corticospinal tract data.
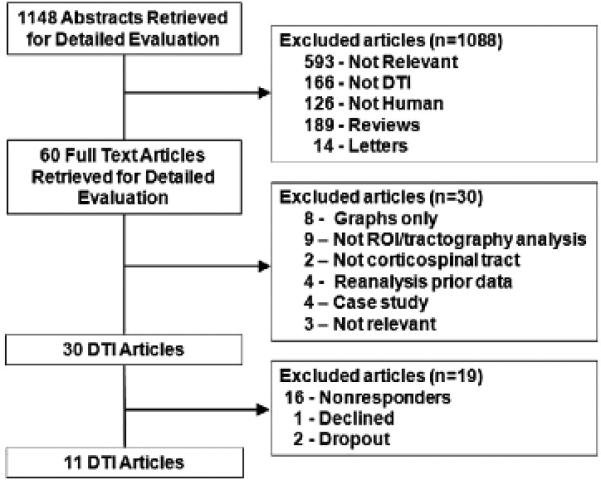
Materials and methods: MEDLINE, EMBASE, CINAHL, and Cochrane databases (1966-April 2011) were searched. Studies were included if they used DTI region of interest or tractography techniques to compare mean cerebral corticospinal tract fractional anisotropy values between ALS subjects and healthy controls. Corresponding authors from the identified articles were contacted to collect individual patient data. IPD meta-analysis and meta-regression were performed using Stata. Meta-regression covariate analysis included age, gender, disease duration, and Revised Amyotrophic Lateral Sclerosis Functional Rating Scale scores.
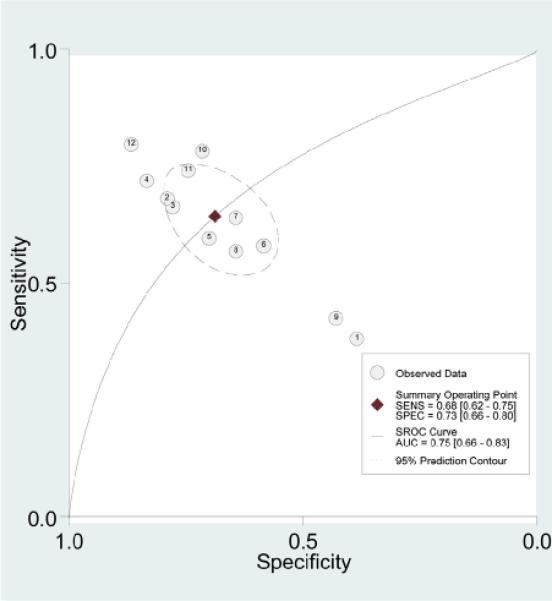
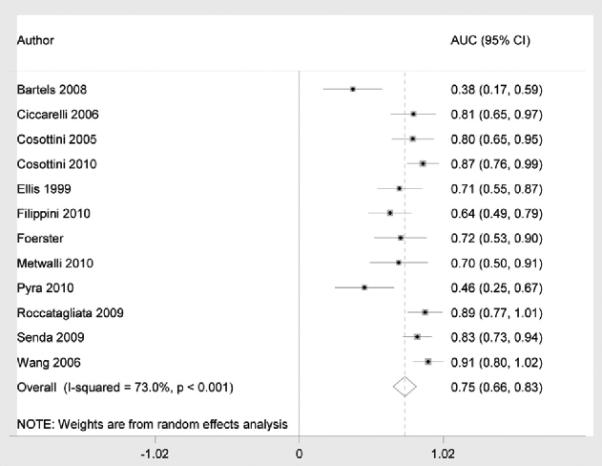
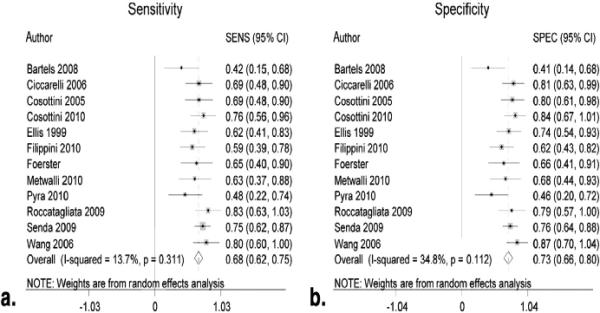
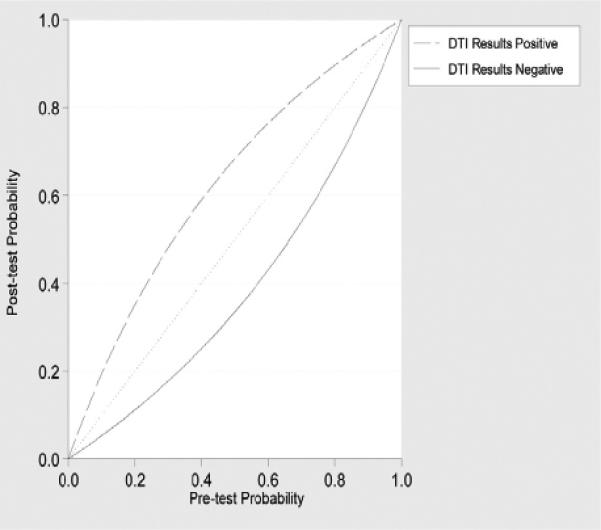
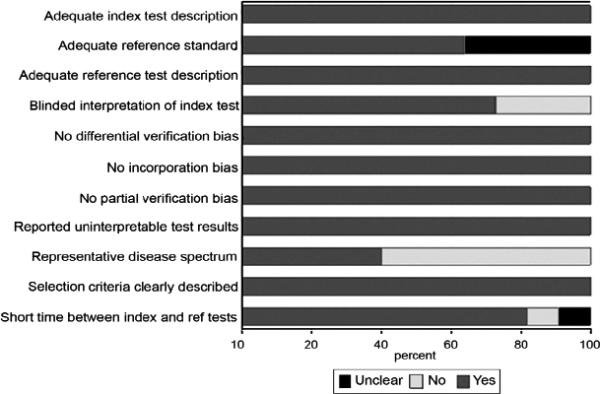
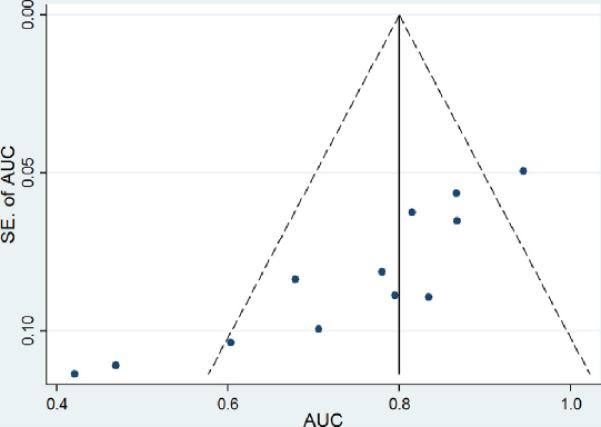
Results: Of 30 identified studies, 11 corresponding authors provided IPD and 221 ALS patients and 187 healthy control subjects were available for study. Pooled area under the receiver operating characteristic curve (AUC) was 0.75 (95% CI: 0.66-0.83), pooled sensitivity was 0.68 (95% CI: 0.62-0.75), and pooled specificity was 0.73 (95% CI: 0.66-0.80). Meta-regression showed no significant differences in pooled AUC for each of the covariates. There was moderate to high heterogeneity of pooled AUC estimates. Study quality was generally high. Data from 19 of the 30 eligible studies were not ascertained, raising possibility of selection bias.
Conclusion: Using corticospinal tract individual patient data, the diagnostic accuracy of DTI appears to lack sufficient discrimination in isolation. Additional research efforts and a multimodal approach that also includes ALS mimics will be required to make neuroimaging a critical component in the workup of ALS.
Keywords: Amyotrophic lateral sclerosis; diagnostic accuracy; diagnostic imaging; diffusion tensor imaging; magnetic resonance imaging; meta-analysis.
Copyright © 2013 AUR. Published by Elsevier Inc. All rights reserved.
Figures
References
-
- Zoccolella S, Beghi E, Palagano G, et al. Predictors of delay in the diagnosis and clinical trial entry of amyotrophic lateral sclerosis patients: a population-based study. J Neurol Sci. 2006;250:45–49. - PubMed
-
- Kraemer M, Buerger M, Berlit P. Diagnostic problems and delay of diagnosis in amyotrophic lateral sclerosis. Clin Neurol Neurosurg. 2010;112:103–105. - PubMed
-
- Kaufmann P, Mitsumoto H. Amyotrophic lateral sclerosis: objective upper motor neuron markers. Curr Neurol Neurosci Rep. 2002;2:55–60. - PubMed
-
- Turner MR, Kiernan MC, Leigh PN, et al. Biomarkers in amyotrophic lateral sclerosis. Lancet Neurol. 2009;8:94–109. - PubMed
Publication types
MeSH terms
Grants and funding
LinkOut - more resources
Full Text Sources
Other Literature Sources
Medical
Miscellaneous
