. 2013 Aug;55(2):61-7.
doi: 10.2144/000114063.

Simultaneous digital quantification and fluorescence-based size characterization of massively parallel sequencing libraries

Affiliations

Simultaneous digital quantification and fluorescence-based size characterization of massively parallel sequencing libraries

Matthew T Laurie et al. Biotechniques. 2013 Aug.

Abstract

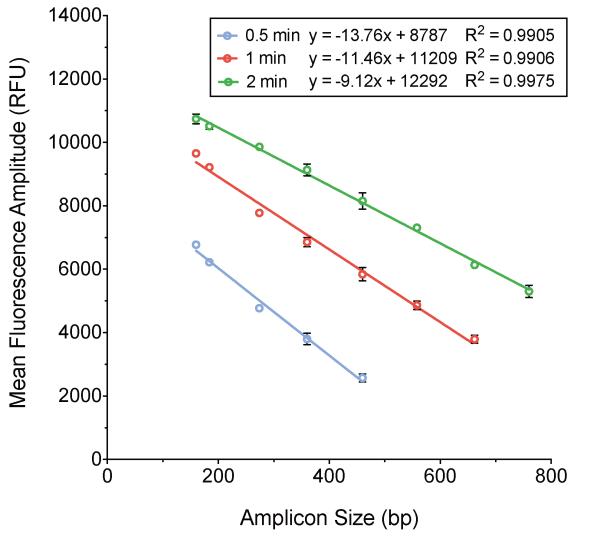
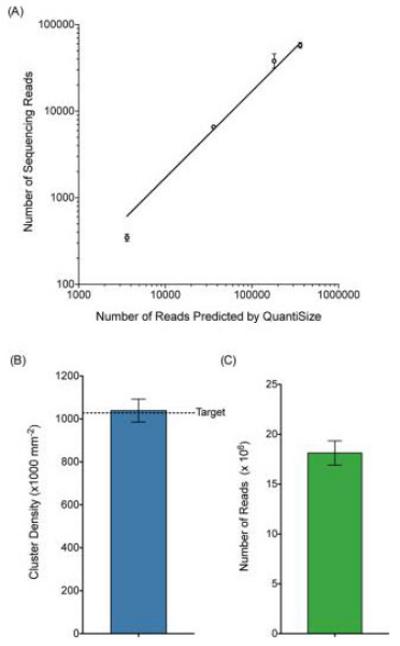
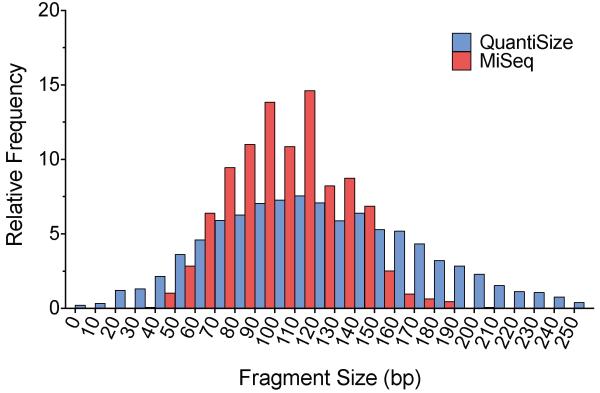
Due to the high cost of failed runs and suboptimal data yields, quantification and determination of fragment size range are crucial steps in the library preparation process for massively parallel sequencing (or next-generation sequencing). Current library quality control methods commonly involve quantification using real-time quantitative PCR and size determination using gel or capillary electrophoresis. These methods are laborious and subject to a number of significant limitations that can make library calibration unreliable. Herein, we propose and test an alternative method for quality control of sequencing libraries using droplet digital PCR (ddPCR). By exploiting a correlation we have discovered between droplet fluorescence and amplicon size, we achieve the joint quantification and size determination of target DNA with a single ddPCR assay. We demonstrate the accuracy and precision of applying this method to the preparation of sequencing libraries.


Figures

Figure 1
Figure 1. ddPCR amplification of 10 size standards designed for use with the QuantiSize assay
All size standards were amplified in parallel with standard reagent and thermal cycling conditions. (A) Scatter plot of fluorescence amplitude of individual droplets for each size standard. Droplets whose fluorescence amplitude is above a specified threshold (“positives”) are shown in black and droplets with fluorescence amplitude below the threshold (“negatives”) are shown in grey. (B) Box-and-whisker plots showing distribution of fluorescence amplitudes of positive droplets. Horizontal bars mark the mean fluorescence amplitude, boxes mark the interquartile range, and whiskers mark the 95% confidence interval. (C) Plot of mean fluorescence amplitude ± SEM versus amplicon size showing a linear correlation (R2=0.9943).
Figure 2
Figure 2. Effect of ddPCR elongation time on the relationship between fluorescence amplitude ± SEM and amplicon size
Three ddPCR experiments were carried out with the same size standards using 0.5, 1, and 2 minute elongation times during droplet thermal cycling. With a 0.5 minute elongation time (blue), the slope of the regression line relating fluorescence amplitude to amplicon size was -13.760 (R2=0.9905). With a 1 minute elongation time (red), the slope was -11.460 (R2=0.9906). With a 2 minute elongation time (green), the slope was -9.123 (R2=0.9975). As the magnitude of the slope of the relationship between fluorescence amplitude and amplicon size increases, so does the ability to accurately resolve small differences in amplicon size. Larger templates require longer elongation times for positive droplets to fluoresce discernibly above the background level of droplet fluorescence.
Figure 3
Figure 3. Cluster density and number of sequencing reads ± SEM across multiple sequencing runs performed using QuantiSize
(A) Eight uniquely indexed libraries were loaded onto the MiSeq with two libraries at each concentration. The libraries were loaded in a concentration ratio of 100:50:10:1 based on ddPCR measurements. Due to the binding kinetics of library molecules on the MiSeq flow cell, the number of reads generated by the MiSeq is expected to be a fraction of the number of library molecules loaded. The relative numbers of MiSeq reads for each library closely correspond to the relative numbers of molecules loaded according to ddPCR measurements (R2=0.9693). (B) Mean cluster density (± SEM) resulting from three separate sequencing runs using Nextera-prepared samples normalized based on QuantiSize measurements. The target cluster density (represented by a horizontal dashed line) was 1.028×10⁶ clusters/mm2 including a 5% phi X control and the observed mean cluster density from the three runs was 1.039 ± 0.053×10⁶ cluster/mm2. (C) Mean number of reads (± SEM) resulting from three separate sequencing runs. The observed mean number of reads was 1.813 ± 0.070×10⁷.
Figure 4
Figure 4. Comparison of library molecule size distribution
The QuantiSize assay was performed on a DNA library prepared for the MiSeq in order to predict the distribution of library molecule sizes. The DNA library was amplified in parallel with a set of size standards using the same primers and TaqMan probe, allowing us to estimate the expected amplicon size within each individual droplet. The resulting size distribution is shown in blue. The actual size distribution was determined through paired-end sequencing on the Illumina MiSeq system (shown in red). Both histograms show the relative frequency of measured molecule sizes in 10 base pair bins. The size distribution measured by QuantiSize is naturally wider than the distribution measured by the MiSeq due to the inherent variance in droplet amplitude that occurs even with amplicons of the same length. The DNA library was amplified in parallel with a set of size standards using the same primers and TaqMan probe, allowing us to estimate the expected amplicon size within each individual droplet.

References

    1. Didelot X, Bowden R, Wilson DJ, Peto TE, Crook DW. Transforming clinical microbiology with bacterial genome sequencing. Nature reviews. Genetics. 2012;13:601–612. - PMC - PubMed
    1. Biesecker LG, Burke W, Kohane I, Plon SE, Zimmern R. Next-generation sequencing in the clinic: are we ready? Nature reviews. Genetics. 2012;13:818–824. - PMC - PubMed
    1. Martin JA, Wang Z. Next-generation transcriptome assembly. Nature reviews. Genetics. 2011;12:671–682. - PubMed
    1. Voelkerding KV, Dames SA, Durtschi JD. Next-generation sequencing: from basic research to diagnostics. Clinical chemistry. 2009;55:641–658. - PubMed
    1. Su Z, Ning B, Fang H, Hong H, Perkins R, Tong W, Shi L. Next-generation sequencing and its applications in molecular diagnostics. Expert review of molecular diagnostics. 2011;11:333–343. - PubMed

Publication types