. 2013 Aug 15;154(4):904-13.
doi: 10.1016/j.cell.2013.07.027. Epub 2013 Aug 8.

Genetically targeted optical electrophysiology in intact neural circuits

Affiliations

Genetically targeted optical electrophysiology in intact neural circuits

Guan Cao et al. Cell. .

Abstract

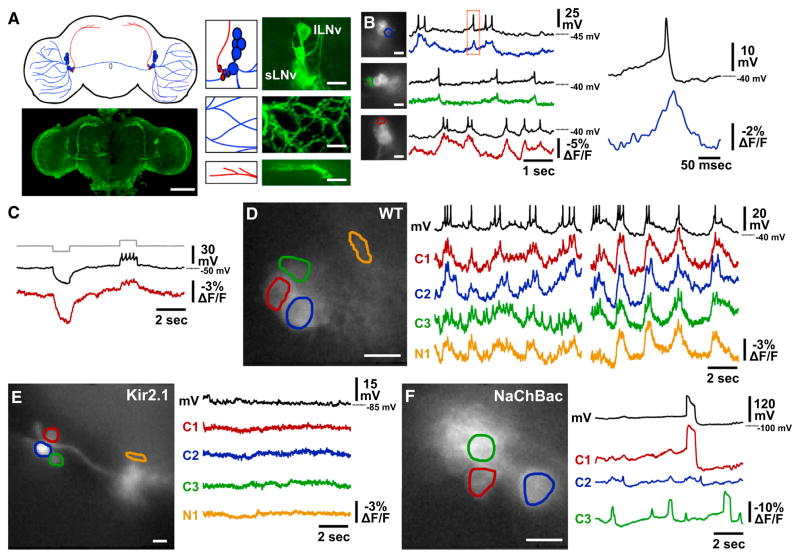
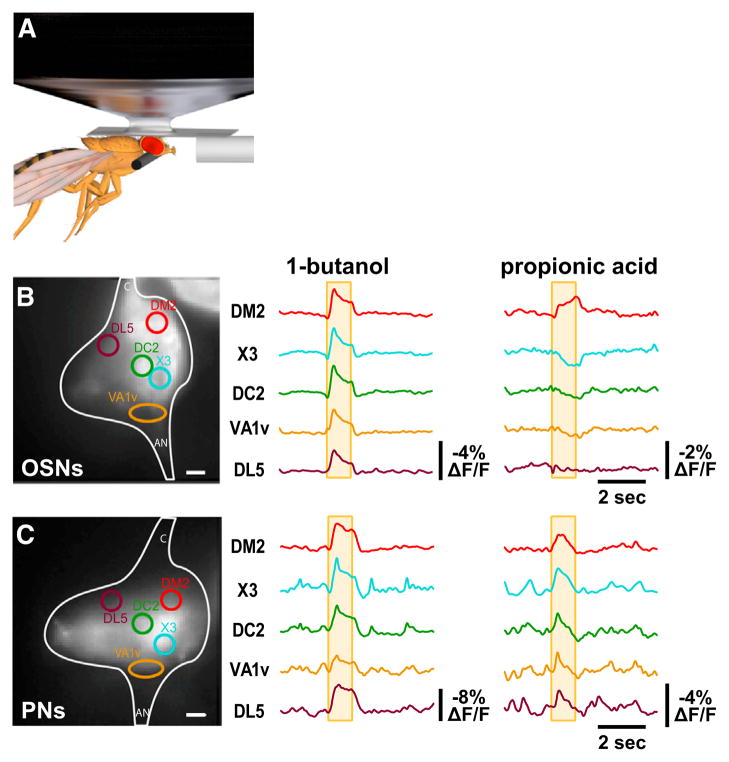
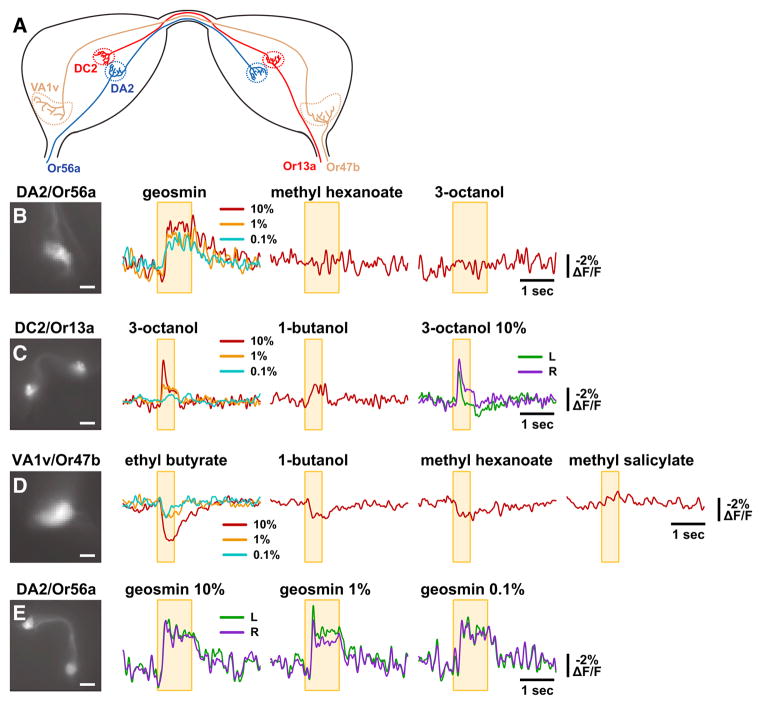
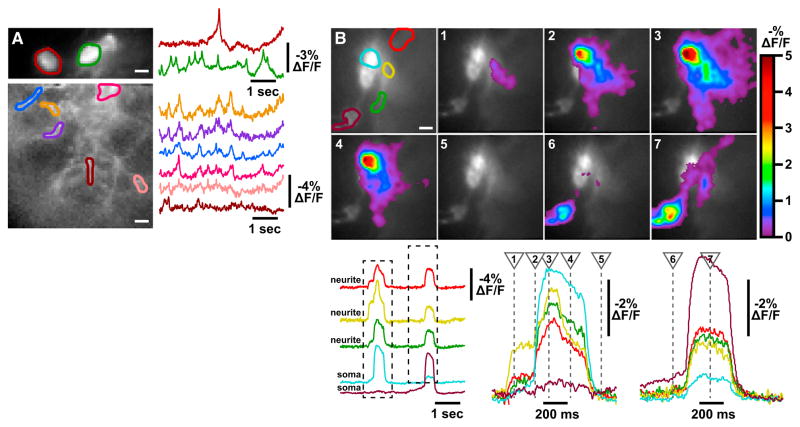
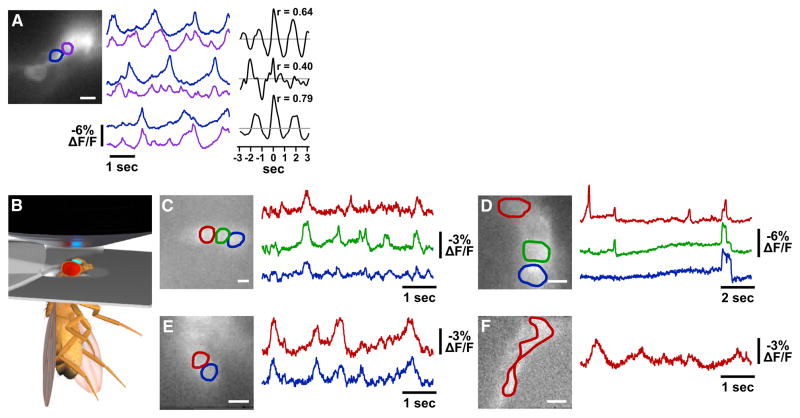
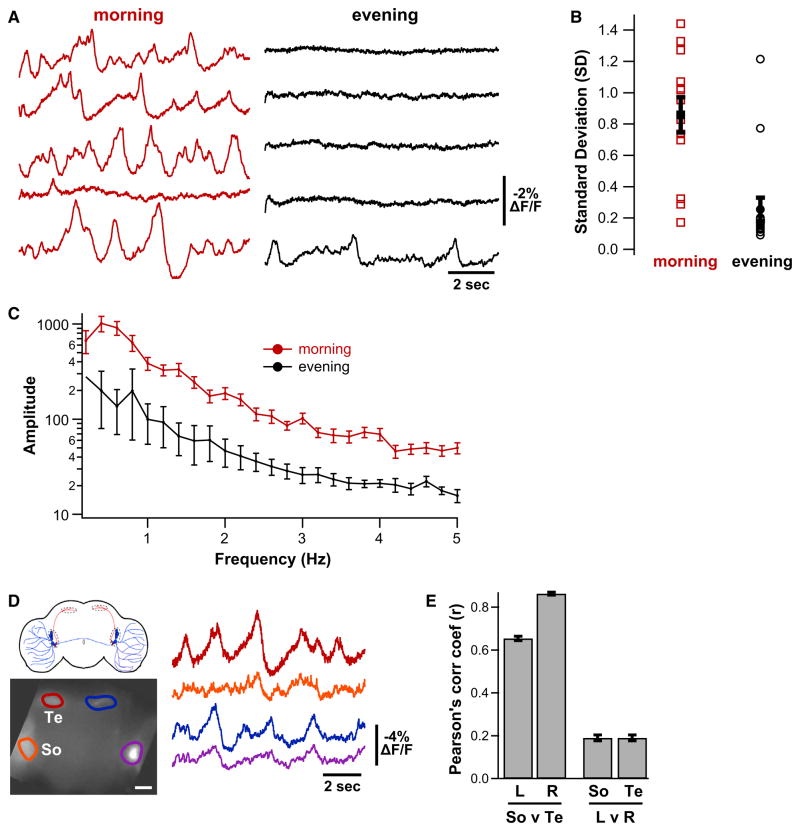
Nervous systems process information by integrating the electrical activity of neurons in complex networks. This motivates the long-standing interest in using optical methods to simultaneously monitor the membrane potential of multiple genetically targeted neurons via expression of genetically encoded fluorescent voltage indicators (GEVIs) in intact neural circuits. No currently available GEVIs have demonstrated robust signals in intact brain tissue that enable reliable recording of individual electrical events simultaneously in multiple neurons. Here, we show that the recently developed "ArcLight" GEVI robustly reports both subthreshold events and action potentials in genetically targeted neurons in the intact Drosophila fruit fly brain and reveals electrical signals in neurite branches. In the same way that genetically encoded fluorescent sensors have revolutionized the study of intracellular Ca(2+) signals, ArcLight now enables optical measurement in intact neural circuits of membrane potential, the key cellular parameter that underlies neuronal information processing.


Figures

Figure 1
Figure 1. Single-Trial Optical Recordings of Subthreshold and Action Potentials in Intact Neural Circuits using ArcLight Genetically Encoded Voltage Sensor
(A) ArcLight expression in Drosophila melanogaster lateral ventral clock neurons (LNVs) is schematized at the top left. Large LNVs (lLNVs) and their neurites are illustrated in blue, and small LNVs (sLNVs) and their dorsomedial peptidergic terminal projections in red. Confocal images of anti-GFP immunofluorescence of a whole-brain explant (bottom, left), LNV somata (top, right), lLNV neurites in the optic lobe (middle, right), and sLNV dorsomedial peptidergic terminal projections (bottom, right) are shown. Scale bar, 100 μm on the left, 10 μm on the right. (B) Three examples of simultaneous, single-trial, whole-cell patch-clamp and optical recordings of lLNvs in situ in whole-brain explants. Sample frames of 80 × 80 depixelated images of each recording are shown on the left, with ROI for optical analysis outlined to indicate the neuron recorded from electrically; black traces corresponding to each image are whole-cell patch-clamp recordings, whereas colored traces are optical recordings. Expanded view of boxed region is shown on the right. Scale bars in all images, 10 μm. Three representative examples are shown from eight total dual patch-optical recordings. (C) Simultaneous patch-clamp and optical recordings of lLNV in a whole-brain explant injected with 10 pA steps of hyperpolarizing and depolarizing current. The current is shown in gray, patch-clamp membrane voltage in black, and ArcLight optical signal in red. This example is representative of seven experiments. (D) Optical recording of somata of multiple neurons (C1–3) and one neurite (N1) reveal synchronous membrane activity of wild-type lLNVs. ROIs are outlined in colors corresponding to the optical traces, with the simultaneous whole-cell patch-clamp recording of the cell in the red ROI shown in black. This example is representative of eight experiments. (E) Kir2.1 expression silences lLNV membrane activity. This example is representative of seven experiments. (F) NaChBac expression induces large long-duration action potentials. This example is representative of eight experiments. See also Figures S1, S2, S3, S4, S5, and S6.
Figure 2
Figure 2. Single-Trial In Vivo Optical Recordings of Odor-Induced Membrane Activity in all OSNs or Projection Neurons
(A) Schematic diagram of in vivo preparation for optical recording of odor-induced membrane activity in the antennal lobe. (B) Optical recordings of odor-induced membrane activity in the presynaptic terminals of olfactory sensory neurons in response to either butanol or propionic acid. The yellow box indicates the timing of the odor application, and the antennal lobe glomeruli are identified by standard names as in Hallem and Carlson (2006) and Silbering et al. (2008). This example is representative of three experiments. Scale bar, 10 μm. (C) Optical recordings of odor-induced membrane activity in the postsynaptic terminals of projection neurons. This example is representative of three experiments. Scale bar, 10 μm.
Figure 3
Figure 3. Single-Trial In Vivo Optical Recordings of Odor-Induced Membrane Activity in Specific OSNs
(A) Schematic diagram of the bilateral antennal lobes depicting the bilateral projections to their respective glomeruli of olfactory sensory neurons expressing either Or56a, Or13a, or Or47b. (B–E) Optical recordings of odor-induced membrane activity in the presynaptic terminals of olfactory sensory neurons expressing the indicated Or in response to the indicated odorants. The yellow box indicates the timing of the odor application, and the antennal lobe glomeruli are identified by standard names. Odorant concentrations are indicated by the color of the traces for the unilateral recordings, or directly for the bilateral recordings, where the left and right glomeruli are indicated by the color of the traces. Scale bars, 10 μm in C and E and 20 μm in D and F. These examples are representative of three recordings of each glomerulus/Or, with each odorant shown tested in at least two of the three recordings.
Figure 4
Figure 4. Optical Detection of Signal Propagation in Neuronal Networks
(A) Top: optical recording of asynchronous spontaneous activity of two lLNV somata in whole-brain explant. Bottom: optical recording of spontaneous activity in neurite branches in the same brain. This example is representative of ten experiments. (B) Optical recording of spontaneous activity in NaChBac-expressing lLNVs in whole-brain explant. ROIs in the top left image indicate two lLNV somata (blue and brown) and three neurite regions (red, yellow, green). ArcLight fluorescence changes at seven time points during a 5 s trial are shown in pseudocolor on the image frames depicting those time points. Optical signals corresponding to each ROI are shown below, with expanded views of the boxed regions on the right, and with the times of the image frames indicated with dashed lines. This example is representative of eight experiments. Scale bars, horizontal, 10 μm in all ROI images. See also Movie S1.
Figure 5
Figure 5. Optical Recordings of Multiple Individual Neurons in Brain Explants and In Vivo
(A) Simultaneous optical recording of spontaneous activity in two sLNVs (blue and purple) in a whole-brain explant for three consecutive epochs. Sliding-window linear cross-correlations of the two sLNVs for each trial are shown, also indicating the peak Pearson’s correlation coefficient, r. The gray lines indicate r = 0. This example is representative of eight experiments. Scale bar, 10 μm. (B) Schematic diagram of in vivo preparation for optical recording of membrane activity in clock neurons. (C–F) In vivo optical recording of spontaneous activity in three wild-type lLNV somata, three NaChBac-expressing lLNV somata, two wild-type sLNV somata, and wild-type slLNV distal terminal projections, respectively. These examples are representative of ten, six, four, and four experiments, respectively. Scale bars, 10 μm.
Figure 6
Figure 6. Optical Recording of Daily Rhythm of Peptidergic Terminal Membrane Activity in Intact Brain
(A) Representative 10 s optical recordings of spontaneous membrane activity in sLNV distal peptidergic terminals in independent hemispheres of whole-brains explanted either in the morning (just after lights-on) or in the evening (just after lights-off) from flies maintained in 12 hr:12 hr light:dark conditions. Total Ns > 8 brains and 12 terminal fields for each time point. (B) Standard deviations (SDs) over the recording trial were computed for each terminal field (unfilled symbols), and the mean ± SEM is plotted in filled symbols. Morning SD is significantly greater than evening (unpaired t test, p < 0.0001). (C) Power spectrum was computed for each terminal field using fast Fourier transform with 0.2 Hz bin width. Powers at each frequency were averaged (±SEM) across terminal fields within morning and evening groups. Morning power is significantly greater than evening power (two-way ANOVA with repeated-measures, p < 0.0001). (D) Simultaneous optical recording of spontaneous activity in the LNV soma region (So) and the distal sLNV terminals (Te) in both hemispheres of a whole-brain explant. Scale bar, 20 μm. (E) Linear no-offset cross-correlation analysis between the indicated brain regions in (D) (bars depict r ± SEM).

Comment in

References

    1. Akemann W, Mutoh H, Perron A, Rossier J, Knöpfel T. Imaging brain electric signals with genetically targeted voltage-sensitive fluorescent proteins. Nat Methods. 2010;7:643–649. - PubMed
    1. Akemann W, Mutoh H, Perron A, Park YK, Iwamoto Y, Knöpfel T. Imaging neural circuit dynamics with a voltage-sensitive fluorescent protein. J Neurophysiol. 2012;108:2323–2337. - PubMed
    1. Akerboom J, Chen TW, Wardill TJ, Tian L, Marvin JS, Mutlu S, Calderón NC, Esposti F, Borghuis BG, Sun XR, et al. Optimization of a GCaMP calcium indicator for neural activity imaging. J Neurosci. 2012;32:13819–13840. - PMC - PubMed
    1. Ataka K, Pieribone VA. A genetically targetable fluorescent probe of channel gating with rapid kinetics. Biophys J. 2002;82:509–516. - PMC - PubMed
    1. Baines RA, Uhler JP, Thompson A, Sweeney ST, Bate M. Altered electrical properties in Drosophila neurons developing without synaptic transmission. J Neurosci. 2001;21:1523–1531. - PMC - PubMed

Publication types

Substances

LinkOut - more resources