. 2014 Feb;24(2):321-32.
doi: 10.1016/j.euroneuro.2013.07.005. Epub 2013 Aug 6.

Characterization of electrically evoked field potentials in the medial prefrontal cortex and orbitofrontal cortex of the rat: modulation by monoamines

Affiliations

Characterization of electrically evoked field potentials in the medial prefrontal cortex and orbitofrontal cortex of the rat: modulation by monoamines

Joanne Wallace et al. Eur Neuropsychopharmacol. 2014 Feb.

Abstract

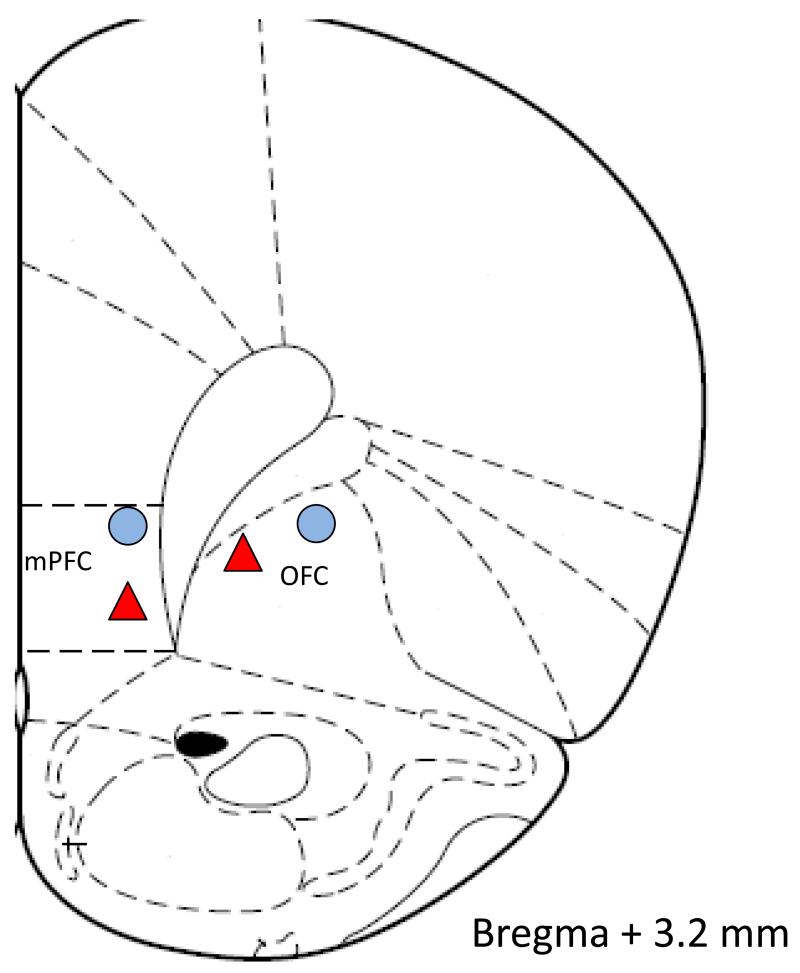
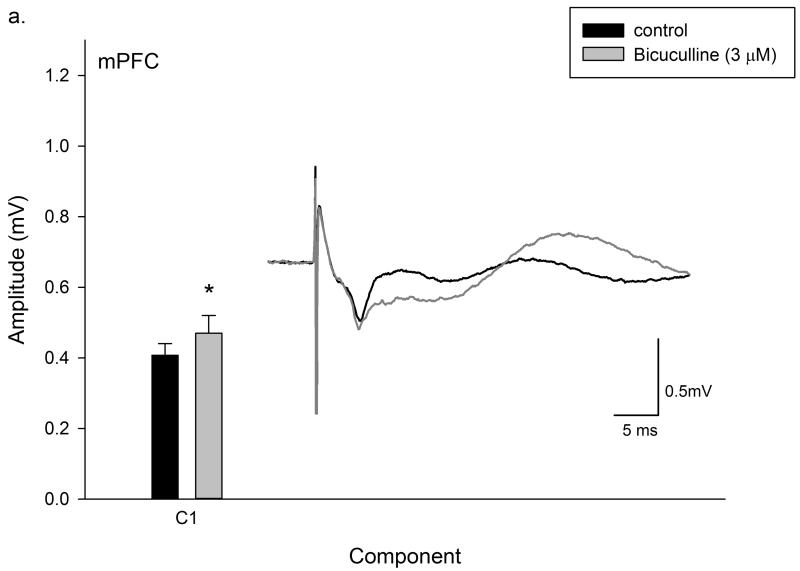
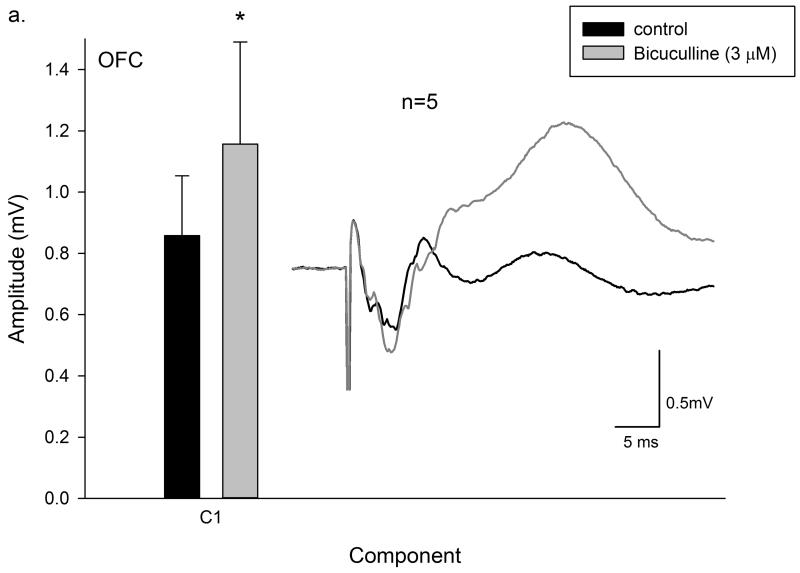
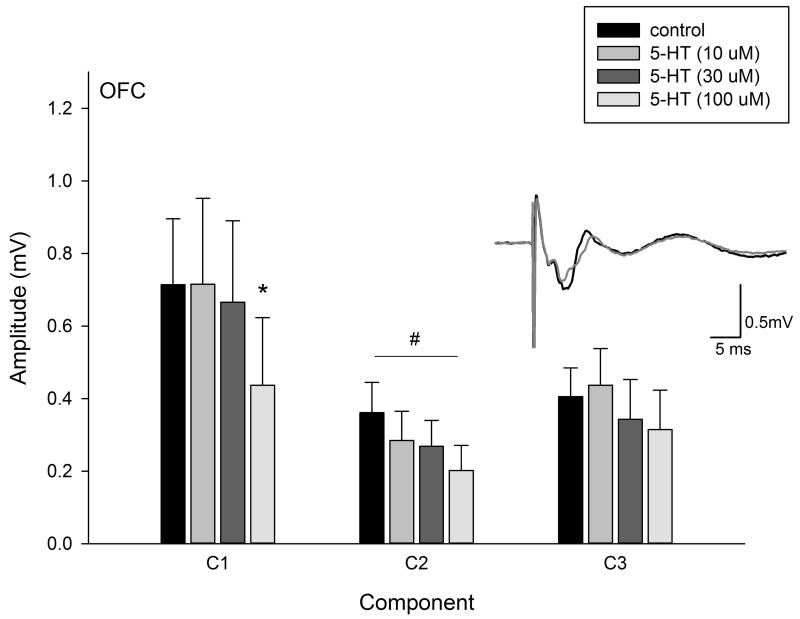
Medial prefrontal cortex (mPFC) and orbitofrontal cortex (OFC) play critical roles in cognition and behavioural control. Glutamatergic, GABAergic, and monoaminergic dysfunction in the prefrontal cortex has been hypothesised to underlie symptoms in neuropsychiatric disorders. Here we characterised electrically-evoked field potentials in the mPFC and OFC. Electrical stimulation evoked field potentials in layer V/VI of the mPFC and layer V of the OFC. The earliest component (approximately 2 ms latency) was insensitive to glutamate receptor blockade and was presumed to be presynaptic. Later components were blocked by 6,7-dinitroquinoxaline-2,3-dione (DNQX (20 µM)) and were assumed to reflect monosynaptic (latency 4-6 ms) and polysynaptic activity (latency 6-40 ms) mediated by glutamate via AMPA/kainate receptor. In the mPFC, but not the OFC, the monosynaptic component was also partly blocked by 2-amino-5-phosphonopentanoic acid (AP-5 (50-100µM)) indicating the involvement of NMDA receptors. Bicuculline (3-10 µM) enhanced the monosynaptic component suggesting electrically-evoked and/or glutamate induced GABA release inhibits the monosynaptic component via GABAA receptor activation. There were complex effects of bicuculline on polysynaptic components. In the mPFC both the mono- and polysynaptic components were attenuated by 5-HT (10-100 µM) and NA (30 and 60 µM) and the monosynaptic component was attenuated by DA (100 µM). In the OFC the mono- and polysynaptic components were also attenuated by 5-HT (100 µM), NA (10-100 µM) but DA (10-100 µM) had no effect. We propose that these pharmacologically characterised electrically-evoked field potentials in the mPFC and OFC are useful models for the study of prefrontal cortical physiology and pathophysiology.

Keywords: 5-HT; Dopamine; GABA; Glutamate; Noradrenaline.


Figures

Figure 1
Figure 1
Plate from The Rat Brain Atlas (Paxinos and Watson, 1986) showing the approximate placement of stimulating electrodes (triangles) and recording electrodes (circles) in the mPFC and OFC.
Figure 2
Figure 2
Drug naïve field potentials in (a) layer V-VI of the IL of the mPFC and (b) layer V of OFC. Data are mean ± SEM (grey shading) of field potentials from 17 and 25 slices, respectively. Letters mark the distinct points of inflection and arrows show how these were converted into components PC and C1-C4.
Figure 2
Figure 2
Drug naïve field potentials in (a) layer V-VI of the IL of the mPFC and (b) layer V of OFC. Data are mean ± SEM (grey shading) of field potentials from 17 and 25 slices, respectively. Letters mark the distinct points of inflection and arrows show how these were converted into components PC and C1-C4.
Figure 3
Figure 3
Field potentials in the mPFC in the absence and presence of (a) DNQX (20 μM) and (b) AP-5 (100 μM). Histograms show mean + s.e.m. (n=7 and 6). Insets shows the mean waveform of the field potential in the absence (control; black line) and presence (grey line) of the drug. Note that DNQX markedly reduces the later components of the field potential but has no effect on PC. AP-5 also slightly reduces C1 without affecting PC. *p<0.05 (paired t test following significant ANOVA; see text for full details).
Figure 3
Figure 3
Field potentials in the mPFC in the absence and presence of (a) DNQX (20 μM) and (b) AP-5 (100 μM). Histograms show mean + s.e.m. (n=7 and 6). Insets shows the mean waveform of the field potential in the absence (control; black line) and presence (grey line) of the drug. Note that DNQX markedly reduces the later components of the field potential but has no effect on PC. AP-5 also slightly reduces C1 without affecting PC. *p<0.05 (paired t test following significant ANOVA; see text for full details).
Figure 4
Figure 4
Field potentials in the OFC in the absence and presence of (a) DNQX (20 μM) and (b) AP-5 (100 μM). Histograms show mean + s.e.m. (n=12 and 9 respectively). Inset shows the mean waveform of the field potential in the absence (control; black line) and presence (grey line) of the drug. Note that DNQX markedly reduces the later components of the field potential but has no effect on PC. AP-5 has no effect on any component of the field potential. *p<0.05 (paired t test following significant ANOVA; see text for full details).
Figure 4
Figure 4
Field potentials in the OFC in the absence and presence of (a) DNQX (20 μM) and (b) AP-5 (100 μM). Histograms show mean + s.e.m. (n=12 and 9 respectively). Inset shows the mean waveform of the field potential in the absence (control; black line) and presence (grey line) of the drug. Note that DNQX markedly reduces the later components of the field potential but has no effect on PC. AP-5 has no effect on any component of the field potential. *p<0.05 (paired t test following significant ANOVA; see text for full details).
Figure 5
Figure 5
Field potentials in the mPFC in the absence and presence of (a) bicuculline (3μM) and (b) bicuculline (10μM). Histograms show mean + s.e.m. (n=7). Insets shows the mean waveform of the field potential in the absence (control; black line) and presence (grey line) of the drug. *p<0.05 (paired t test).
Figure 5
Figure 5
Field potentials in the mPFC in the absence and presence of (a) bicuculline (3μM) and (b) bicuculline (10μM). Histograms show mean + s.e.m. (n=7). Insets shows the mean waveform of the field potential in the absence (control; black line) and presence (grey line) of the drug. *p<0.05 (paired t test).
Figure 6
Figure 6
Field potentials in the OFC in the absence and presence of bicuculline (3μM). Part (a) histogram shows the mean data from 5 slices in which bicuculline increased the potential from around 10 ms after the stimulus (n=5). Part (b) histogram shows the mean data from 3 slices in which bicuculline caused a downward drift in the potential from 10 ms onwards. Insets shows the mean waveform of the field potential in the absence (control; black line) and presence (grey line) of the drug. *p<0.05 (paired t test).
Figure 6
Figure 6
Field potentials in the OFC in the absence and presence of bicuculline (3μM). Part (a) histogram shows the mean data from 5 slices in which bicuculline increased the potential from around 10 ms after the stimulus (n=5). Part (b) histogram shows the mean data from 3 slices in which bicuculline caused a downward drift in the potential from 10 ms onwards. Insets shows the mean waveform of the field potential in the absence (control; black line) and presence (grey line) of the drug. *p<0.05 (paired t test).
Figure 7
Figure 7
Field potentials in the mPFC in the absence and presence of 5-HT (10, 30 and 100μM). Histograms show mean + s.e.m. (n=6). Inset shows the mean waveform of the field potential in the absence (control; black line) and presence (grey line) of 5-HT (100 μM). *p<0.05 (paired t test vs control following significant ANOVA); see text for full statistical analysis.
Figure 8
Figure 8
Field potentials in the OFC in the absence and presence of 5-HT (10, 30 and 100μM). Histograms show mean +s.e.m. (n=8). Inset shows the mean waveform of the field potential in the absence (control; black line) and presence (grey line) of 5-HT (100 μM). *p<0.05 (paired t test vs control following significant ANOVA); #p<0.05 one-way ANOVA. See text for full statistical analysis.
Figure 9
Figure 9
Field potentials in the mPFC in the absence and presence of (a) NA (30 μM) and (b) NA (100 μM). Histograms show mean +s.e.m. (n=8). Inset shows the mean waveform of the field potential in the absence (control; black line) and presence (grey line) of NA (30 and 100 μM). *p<0.05 (paired t test vs control following significant ANOVA).
Figure 9
Figure 9
Field potentials in the mPFC in the absence and presence of (a) NA (30 μM) and (b) NA (100 μM). Histograms show mean +s.e.m. (n=8). Inset shows the mean waveform of the field potential in the absence (control; black line) and presence (grey line) of NA (30 and 100 μM). *p<0.05 (paired t test vs control following significant ANOVA).
Figure 10
Figure 10
Field potentials in the OFC in the absence and presence of NA (10-100 μM). Histograms show mean + s.e.m. (n=14). Inset shows the mean waveform of the field potential in the absence (control; black line) and presence (grey line) of NA (100 μM). *p<0.05 (paired t test vs control following significant ANOVA). See text for full statistical analysis.
Figure 11
Figure 11
Field potentials in the mPFC in the absence and presence of DA (100 μM). Histograms show mean + s.e.m.(n=8). Inset shows the mean waveform of the field potential in the absence (control; black line) and presence (grey line) of DA (100 μM). *p<0.05 (paired t test vs control following significant ANOVA).
Figure 12
Figure 12
Field potentials in the OFC in the absence and presence of DA (10-100 μM). Histogram shows mean + s.e.m. (n=7). Inset shows the mean waveform of the field potential in the absence (control; black line) and presence (grey line) of DA (100 μM).

References

    1. Adlersberg M, Arango V, Hsiung S, Mann JJ, Underwood MD, Liu K, Kassir SA, Ruggiero DA, Tamir H. In vitro autoradiography of serotonin 5-HT(2A/2C) receptor-activated G protein: guanosine-5′-(gamma-[(35)S]thio)triphosphate binding in rat brain. Journal of neuroscience research. 2000;61:674–685. - PubMed
    1. Agster KL, Mejias-Aponte CA, Clark BD, Waterhouse BD. Evidence for a regional specificity in the density and distribution of noradrenergic varicosities in rat cortex. The Journal of comparative neurology. 2012 - PMC - PubMed
    1. Amargos-Bosch M, Bortolozzi A, Puig MV, Serrats J, Adell A, Celada P, Toth M, Mengod G, Artigas F. Co-expression and in vivo interaction of serotonin1A and serotonin2A receptors in pyramidal neurons of prefrontal cortex. Cereb Cortex. 2004;14:281–299. - PubMed
    1. Arvanov VL, Liang X, Magro P, Roberts R, Wang RY. A pre- and postsynaptic modulatory action of 5-HT and the 5-HT2A, 2C receptor agonist DOB on NMDA-evoked responses in the rat medial prefrontal cortex. The European journal of neuroscience. 1999;11:2917–2934. - PubMed
    1. Berlin HA, Rolls ET, Kischka U. Impulsivity, time perception, emotion and reinforcement sensitivity in patients with orbitofrontal cortex lesions. Brain. 2004;127:1108–1126. - PubMed

MeSH terms

LinkOut - more resources