. 2013 Oct;39(10):1861-74.
doi: 10.1016/j.ultrasmedbio.2013.03.029. Epub 2013 Aug 9.

Short-lag spatial coherence imaging of cardiac ultrasound data: initial clinical results

Affiliations

Short-lag spatial coherence imaging of cardiac ultrasound data: initial clinical results

Muyinatu A Lediju Bell et al. Ultrasound Med Biol. 2013 Oct.

Abstract

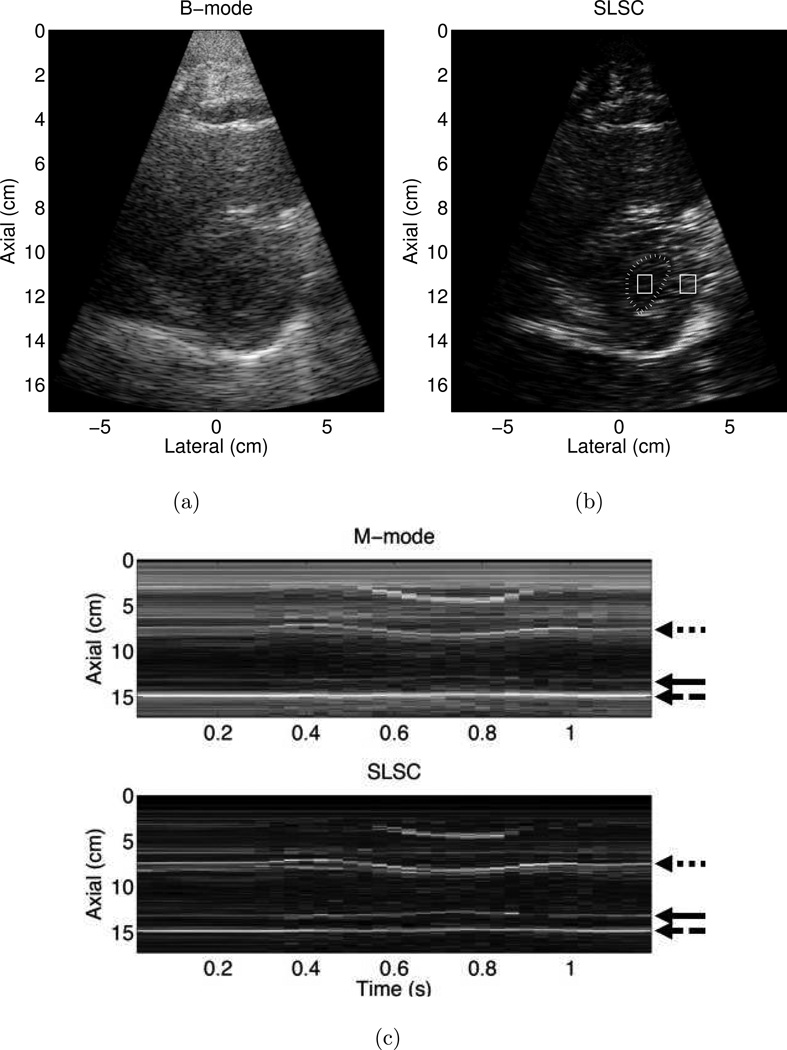
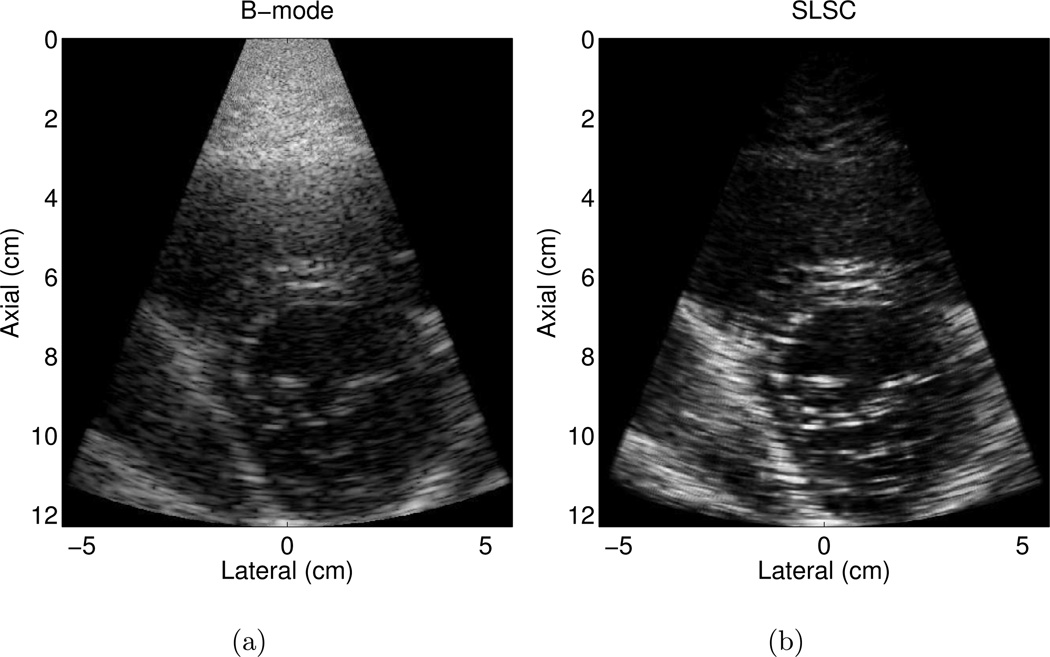
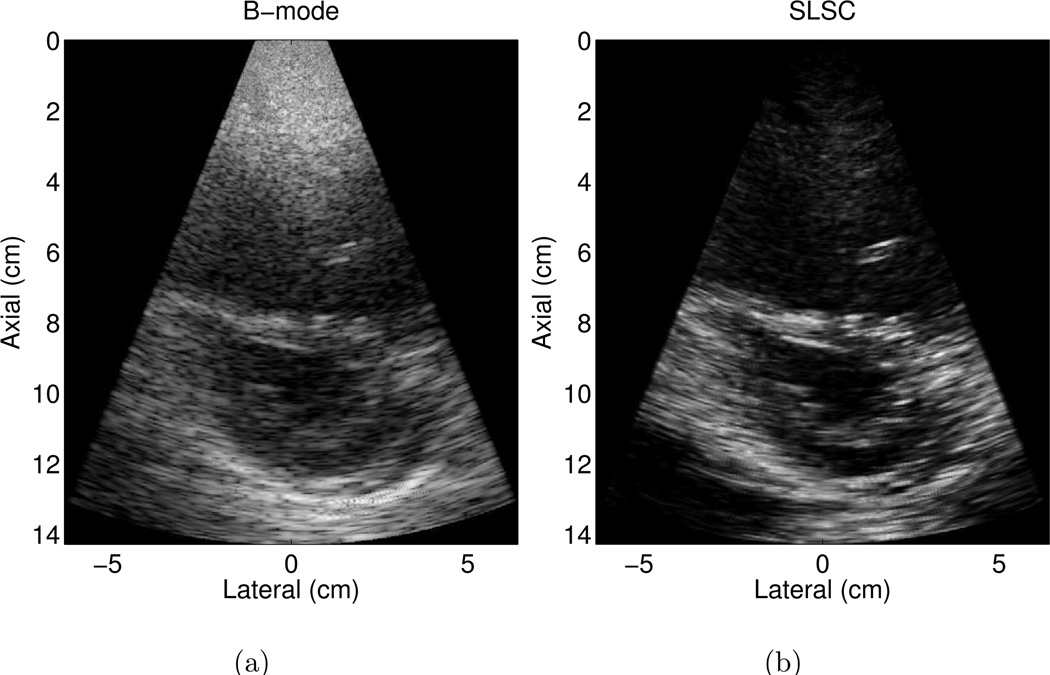
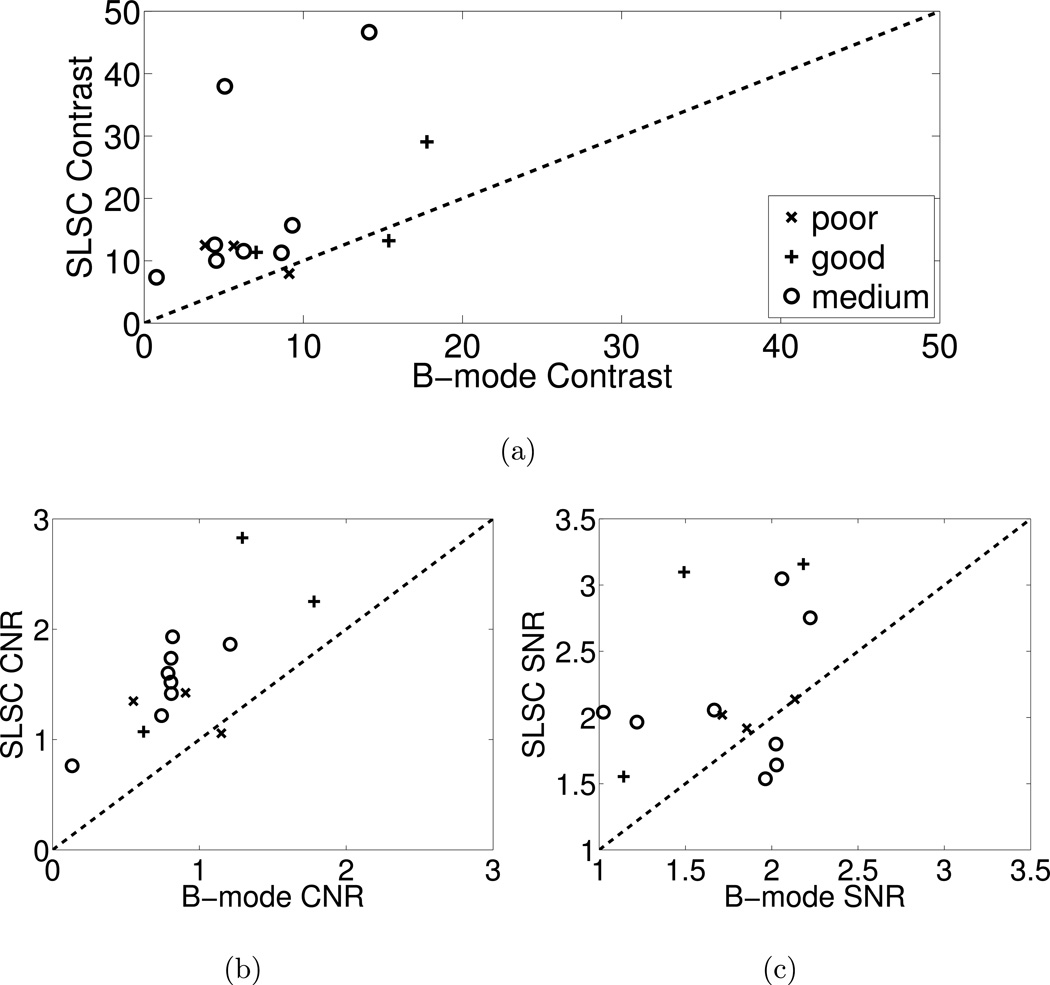
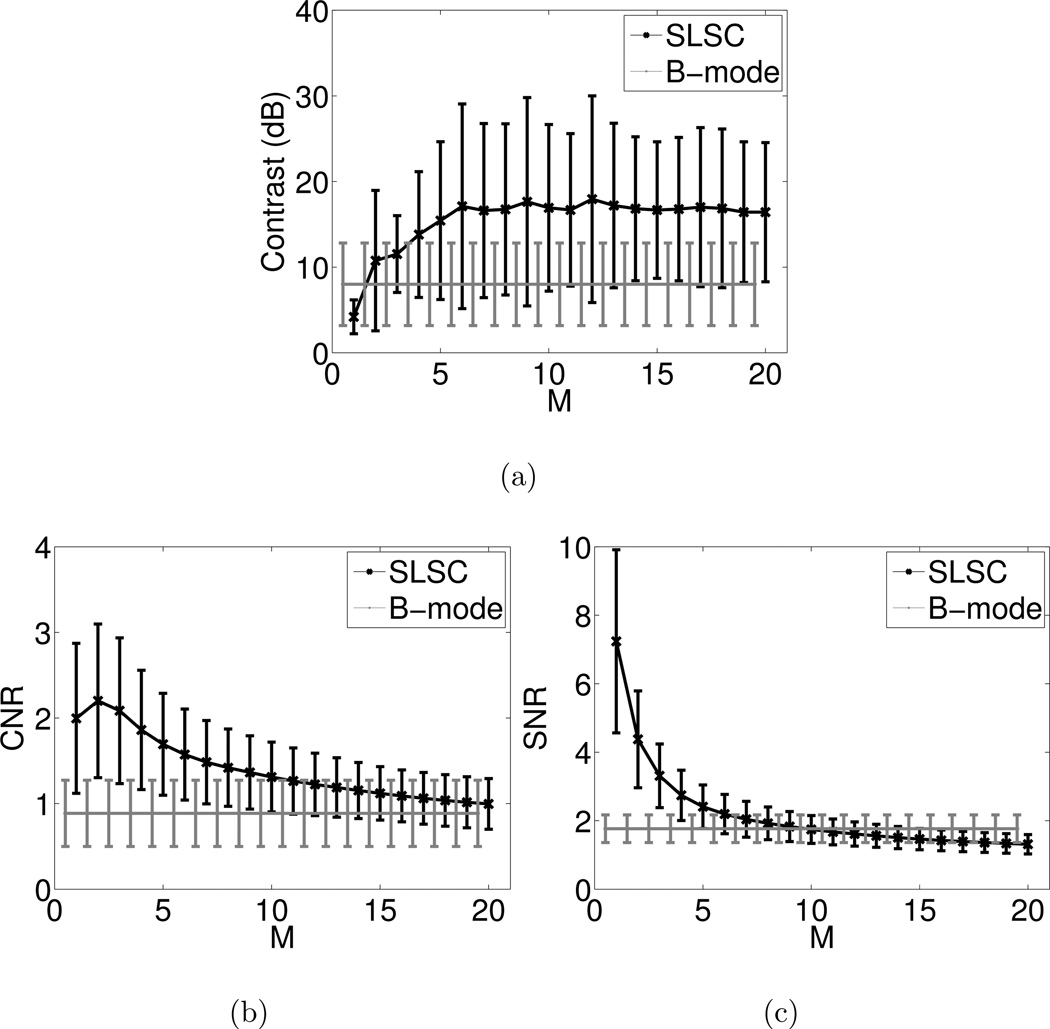
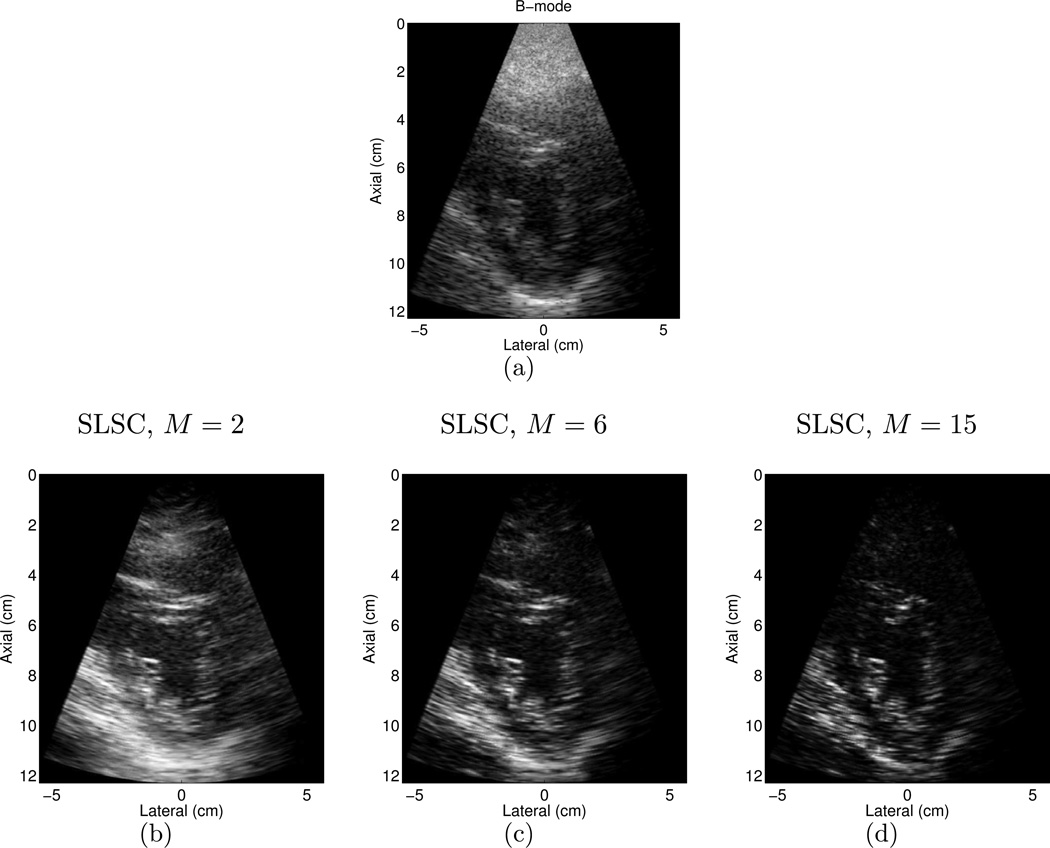
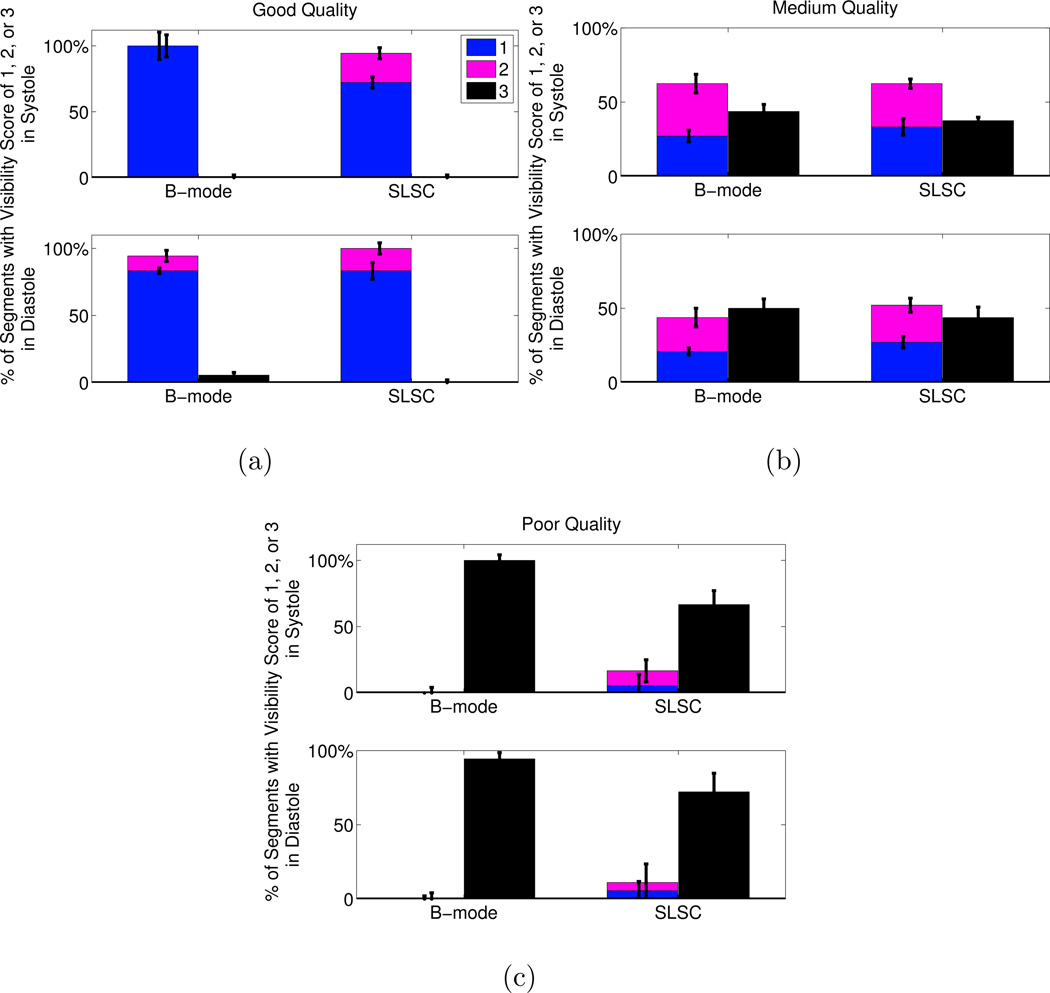
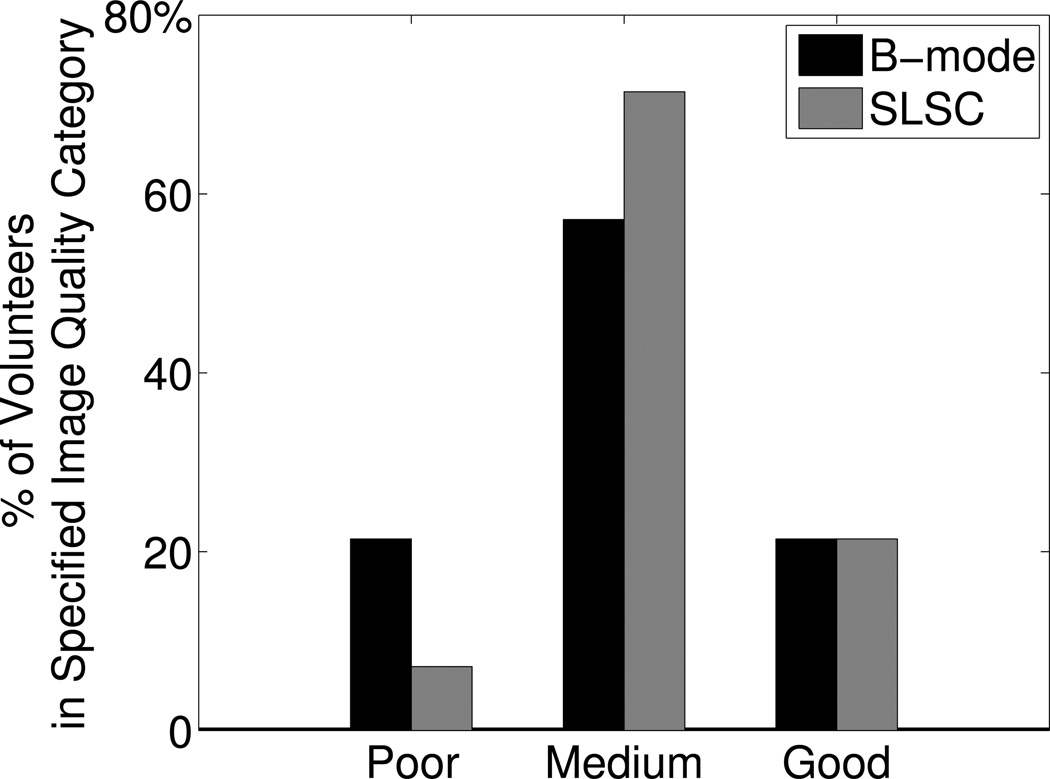
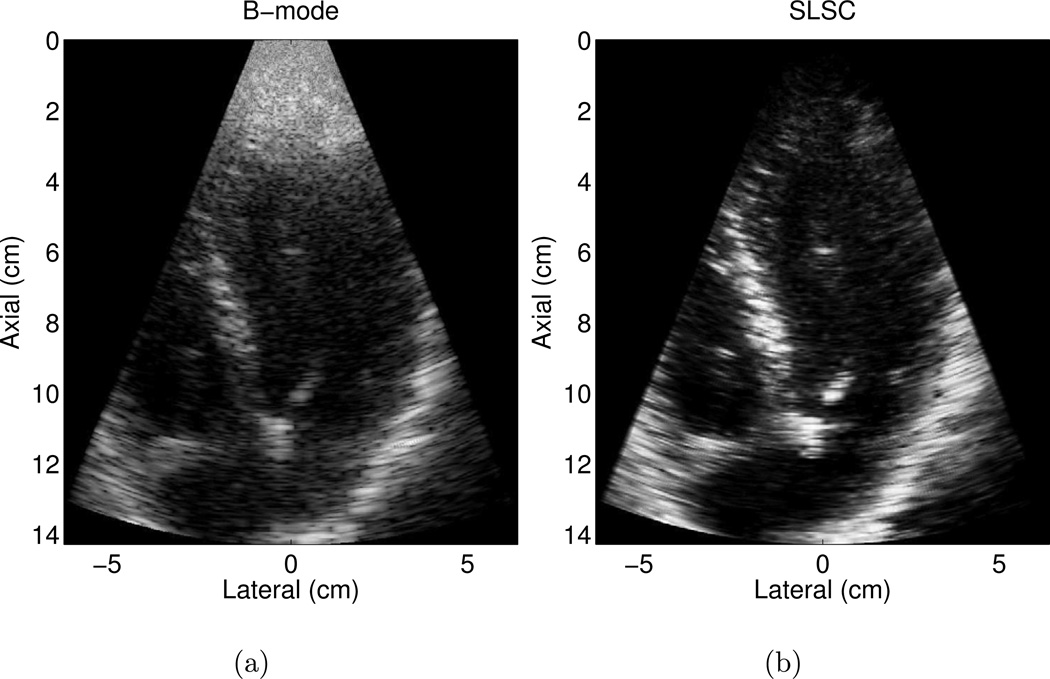
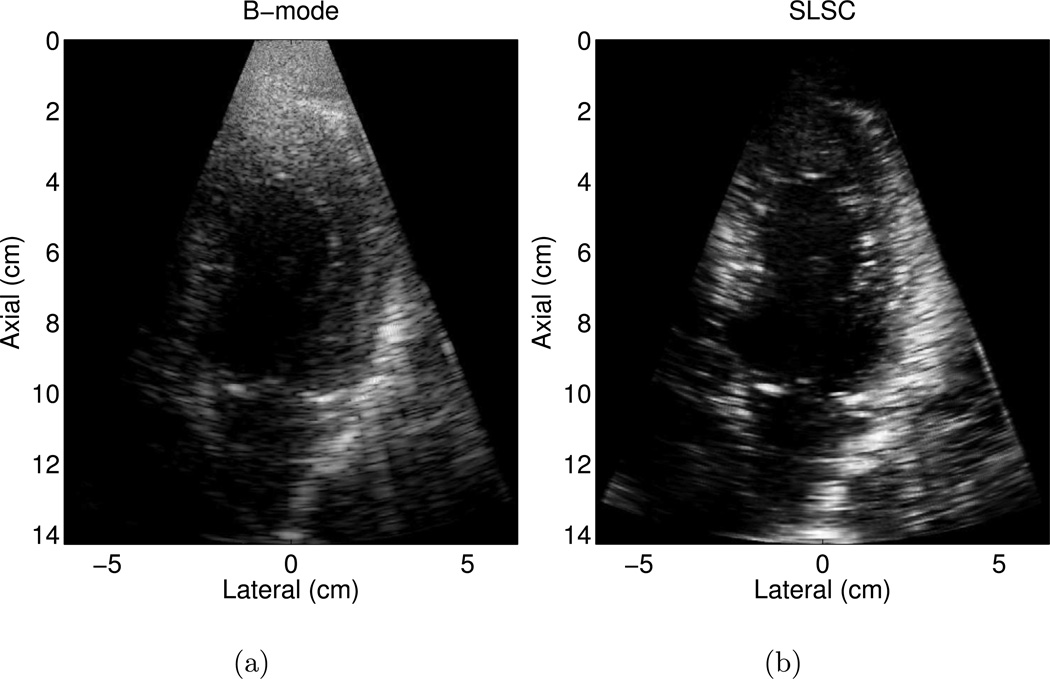
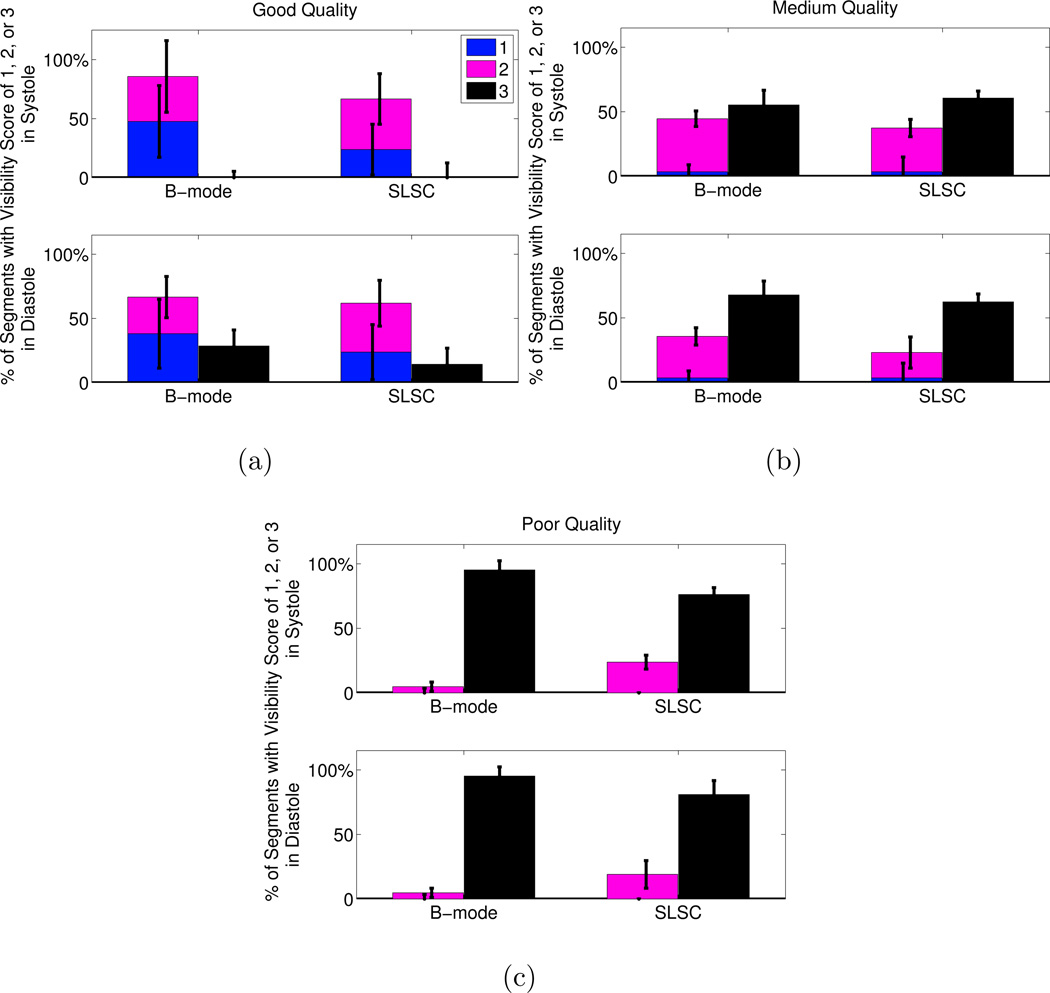
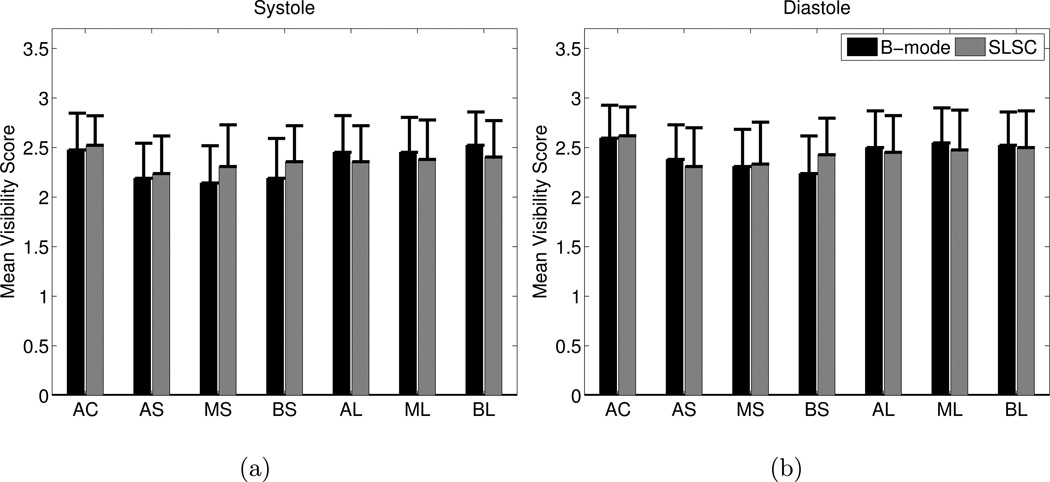
Short-lag spatial coherence (SLSC) imaging is a novel beamforming technique that reduces acoustic clutter in ultrasound images. A clinical study was conducted to investigate clutter reduction and endocardial border detection in cardiac SLSC images. Individual channel echo data were acquired from the left ventricle of 14 volunteers, after informed consent and institutional review board approval. Paired B-mode and SLSC images were created from these data. Contrast, contrast-to-noise, and signal-to-noise ratios were measured in paired images, and these metrics were improved with SLSC imaging in most cases. Three cardiology fellows rated the visibility of endocardial segments in randomly ordered B-mode and SLSC cine loops. SLSC imaging offered 22%-33% improvement (p < 0.05) in endocardial border visibility when B-mode image quality was poor (i.e., 80% or more of the endocardial segments could not be visualized by the three reviewers). The percentage of volunteers with poor-quality images was decreased from 21% to 7% with the SLSC beamformer. Results suggest that SLSC imaging has the potential to improve clinical cardiac assessments that are challenged by clutter.

Keywords: B-mode; Clutter reduction; Coherence-based beamforming; Contrast; Echocardiography; Endocardial border detection; M-mode; Signal-to-noise ratio.


Figures

Figure 1
Figure 1
Schematic of two standard ultrasound views of the heart and associated segments of the left ventricle (LV) walls. There are six segements in the mid-level short axis view and seven segments in the apical four chamber view. Reprinted fromLang et al. (2005) with permission from Elsevier.
Figure 2
Figure 2
Matched (a) B-mode and (b) Short-Lag Spatial Coherence (SLSC) images of the left ventricle of Volunteer 2. The endocardial border was manually outlined (dotted line) with the aid of the associated cine loop, and the outlined boxes were used to calculate contrast, contrast-to-noise ratio (CNR), and signal-to-noise ratio (SNR). (c) Corresponding M-mode and SLSC images as a function of time. The arrows indicate the locations of the anterior endocardial border (dotted arrow), inferior endocardial border (solid arrow), and pericardium (dashed arrow). The axial sampling frequency was 10 MHz, and SLSC images were created with M = 10. B-mode and M-mode images are shown with 50 dB dynamic range, while SLSC images are shown on a linear scale ranging from 0 to 95% of the maximum value.
Figure 3
Figure 3
Matched (a) B-mode and (b) SLSC images of the left ventricle of volunteer 5. The B-mode image is an example of a good quality image, where more than 80% of the endocardial border is visualized. The corresponding SLSC image shows reduced clutter and more well-defined borders. The B-mode image is shown with 50 dB dynamic range, while the SLSC image is shown on a linear scale ranging from 0 to 95% of the maximum value.
Figure 4
Figure 4
Matched (a) B-mode and (b) SLSC images of the left ventricle of volunteer 7. The B-mode image is an example of a poorer quality image, where less than 80% of the endocardial border is clearly visualized. The endocardial border is better defined in the SLSC image. The B-mode image is shown with 50 dB dynamic range, while the SLSC image is shown on a linear scale ranging from 0 to 95% of the maximum value.
Figure 5
Figure 5
Scatter plots of (a) contrast, (b) CNR, and (c) SNR measured in B-mode and SLSC images from the 14 volunteers. The data points are categorized by the B-mode image quality determined from the endocardial visibility scores (i.e. good, medium, or poor). Data points above the dashed line indicate better contrast, CNR, or SNR in the SLSC image compared to the matched B-mode image. The SLSC values were calculated with M = 6.
Figure 6
Figure 6
Mean (a) contrast, (b) CNR, and (c) SNR measured in SLSC images from the 14 volunteers, as a function of the short-lag value M. B-mode measurements are shown as a reference. Error bars indicate ± one standard deviation from the mean.
Figure 7
Figure 7
(a) B-mode image of the LV of volunteer 14, and matched SLSC images created with (a) M = 2, (b) M = 6, and (c) M = 15. Note the changes in contrast, CNR, SNR, and resolution as M is varied. The B-mode image is shown with 50 dB dynamic range, while the SLSC images are shown on a linear scale ranging from 0 to 95% of the maximum value.
Figure 8
Figure 8
Visibility of the segments in the short axis view of the LV. The images were separated by B-mode image quality (good, medium, poor). The number of segments with each visibility score (1=clearly seen, 2=poorly seen, 3=not visible) is expressed as a percentage of the total number of segments in each image quality category. The height of the bars represent the median of the three independent observers and the error bars show the interquartile range for each score category in each image quality category in sytole and diastole. The p-values were (a) 1 in systole and diastole in good quality images, (b) 0.45 and 0.64 in systole and diastole, respectively, in medium quality images, and (c) 0.047 and 0.0078 in systole and diastole, respectively, in poor quality images. The kappa statistics indicate fair agreement among the reviewers (κ = 0.30).
Figure 9
Figure 9
Percentage of volunteers in each image quality category, as defined by the number of visible segments in B-mode or SLSC images of the LV short axis view. Good quality was defined as 80% or more of the endocardial segments were visualized (score = 1 or 2) by the three reviewers in systole and diastole. Poor quality was defined as 80% or more of the endocardial segments could not be visualized (score = 3) by the three reviewers in systole or diastole. Medium quality was neither poor nor good quality. SLSC imaging decreased the percentage of volunteers with poor quality images.
Figure 10
Figure 10
Apical four chamber view of the left ventricle of volunteer 3 in matched (a) B-mode and (b) SLSC images. The endocardial borders are more clearly defined, particularly in the near field. The transmit focus was 8.3 cm. The B-mode image is shown with 50 dB dynamic range, while the SLSC image is shown on a linear scale ranging from 0 to 95% of the maximum value.
Figure 11
Figure 11
Apical four chamber view of the left ventricle of volunteer 2 in matched (a) B-mode and (b) SLSC images. There is reduced clutter in the near field of the SLSC image, and the basal lateral segment appears to be missing in the SLSC image compared to the B-mode image (see Supplemental Video #3 for cine loops of these images). The transmit focus was 8.3 cm. The B-mode image is shown with 50 dB dynamic range, while the SLSC image is shown on a linear scale ranging from 0 to 95% of the maximum value.
Figure 12
Figure 12
Visibility of the segments in the apical four chamber view of the LV. The images were separated by B-mode image quality (good, medium, poor). The number of segments with each visibility score (1=clearly seen, 2=poorly seen, 3=not visible) is expressed as a percentage of the total number of segments in each image quality category. The height of the bars represent the median of the three independent observers and the error bars show the interquartile range for each score category in each image quality category in sytole and diastole. The p-values were (a) 0.50 and 1 in systole and diastole, respectively, in good quality images, (b) 0.55 and 0.35 in systole and diastole, respectively, in medium quality images, and (c) 0.06 and 0.25 in systole and diastole, respectively, in poor quality images. The kappa statistics indicate fair agreement among the reviewers (κ = 0.21).
Figure 13
Figure 13
The mean of the visibility scores (1=clearly seen, 2=poorly seen, 3=not visible) of each segment in B-mode and SLSC images of the apical four chamber view in (a) systole and (b) diastole. AC=apical cap, AS=apical septum, MS=mid inferoseptum, BS=basal inferoseptum, AL=apical lateral, ML=mid anterolateral, and BL=basal anterolateral. The p values exceed 0.05 for all segments in systole and diastole, indicating no statistically significant differences.

References

    1. Al-Mansour H, Mulvagh S, Pumper G, Klarich K, Foley D. Usefulness of harmonic imaging for left ventricular opacification and endocardial border delineation by optison. The American Journal of Cardiology. 2000;856:795–799. - PubMed
    1. Bamber J, Mucci R, Orofino D. Spatial Coherence and Beamformer Gain. Acoustical Imaging. 2000;24:43–48.
    1. Becher H, Tiemann K, Schlosser T, Pohl C, Nanda N, Averkiou M, Powers J, Luderitz B. Improvement in endocardial border delineation using tissue harmonic imaging. Echocardiography. 1998;155:511–517. - PubMed
    1. Bezante G, Rosa G, Bruni R, Chen X, Villa G, Scopinaro A, Balbi M, Barsotti A, Schwarz K. Improved assessment of left ventricular volumes and ejection fraction by contrast enhanced harmonic color Doppler echocardiography. The International Journal of Cardiovascular Imaging (formerly Cardiac Imaging) 2005;216:609–616. - PubMed
    1. Caiati C, Zedda N, Montaldo C, Montisci R, Iliceto S. Contrast-enhanced transthoracic second harmonic echo doppler with adenosine A noninvasive, rapid and effective method for coronary flow reserve assessment. Journal of the American College of Cardiology. 1999;341:122–130. - PubMed

Publication types