. 2013 Aug 8;51(3):310-25.
doi: 10.1016/j.molcel.2013.07.010.

Remodeling of the enhancer landscape during macrophage activation is coupled to enhancer transcription

Affiliations

Remodeling of the enhancer landscape during macrophage activation is coupled to enhancer transcription

Minna U Kaikkonen et al. Mol Cell. .

Abstract

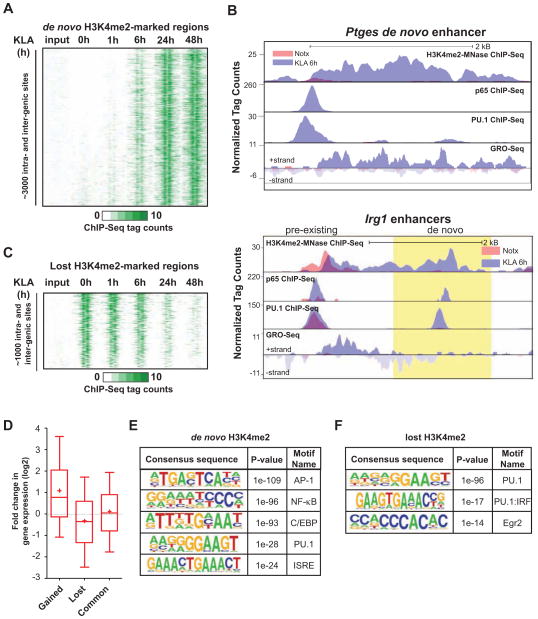
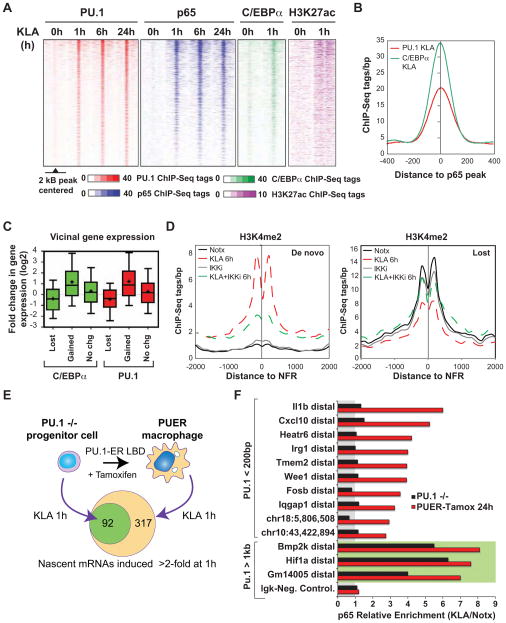
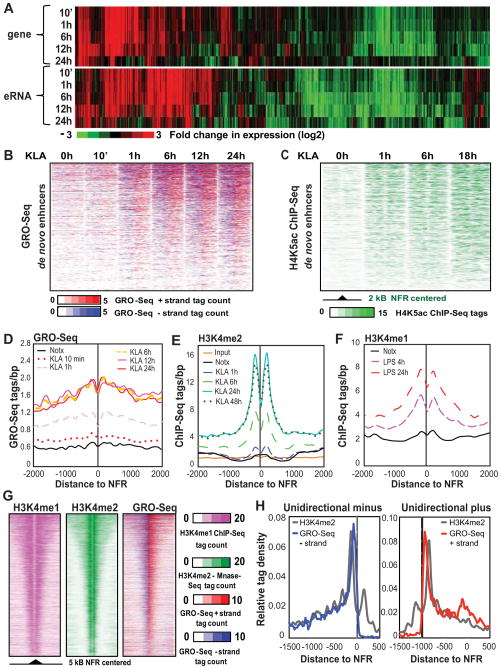
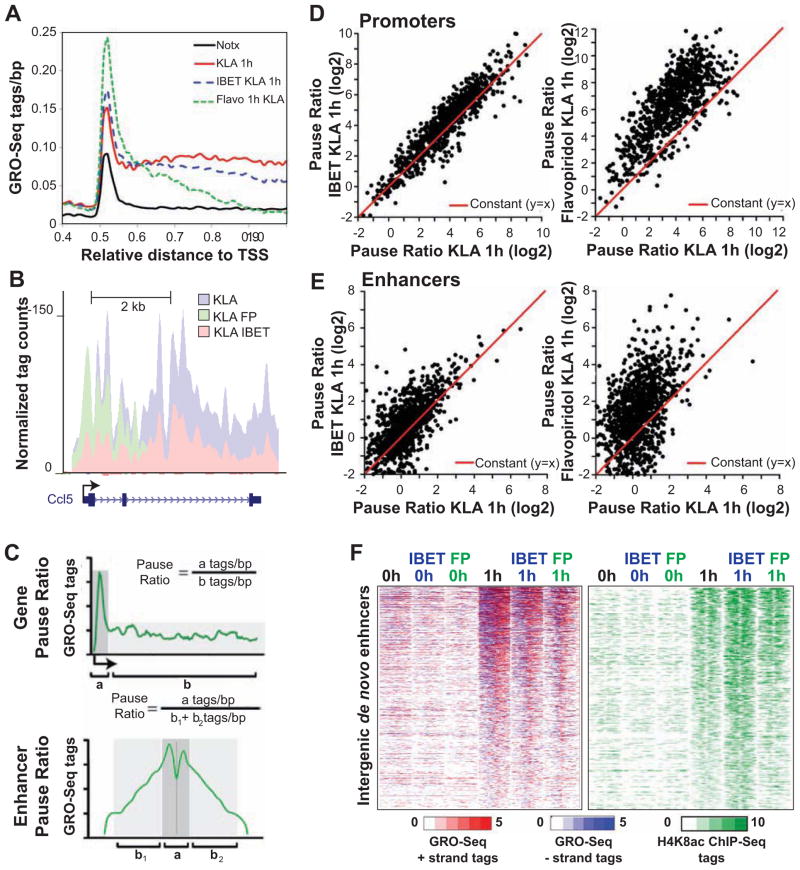
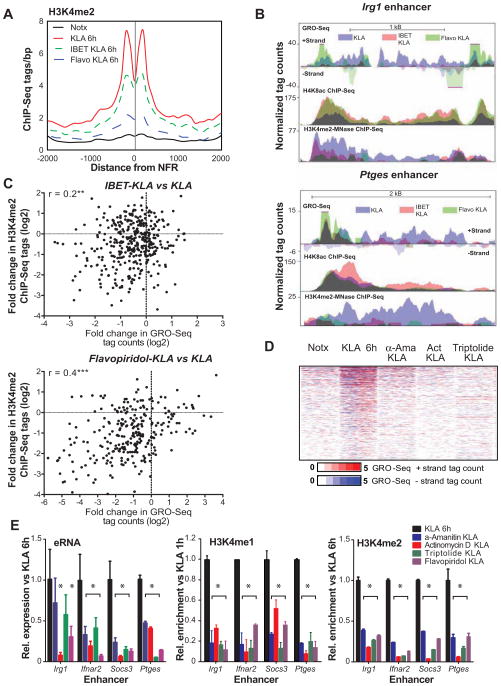
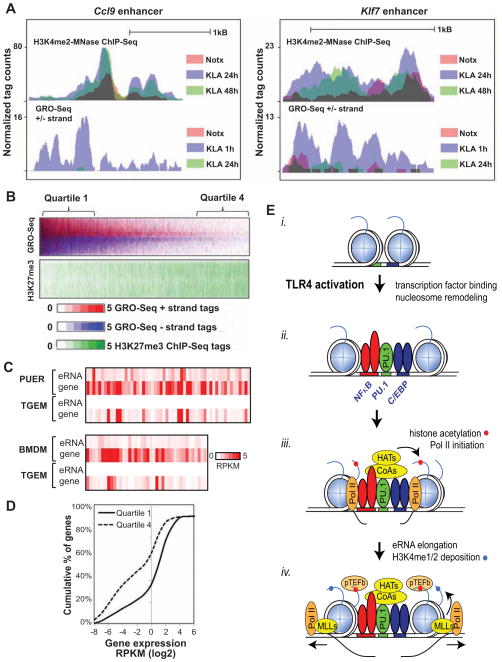
Recent studies suggest a hierarchical model in which lineage-determining factors act in a collaborative manner to select and prime cell-specific enhancers, thereby enabling signal-dependent transcription factors to bind and function in a cell-type-specific manner. Consistent with this model, TLR4 signaling primarily regulates macrophage gene expression through a pre-existing enhancer landscape. However, TLR4 signaling also induces priming of ∼3,000 enhancer-like regions de novo, enabling visualization of intermediates in enhancer selection and activation. Unexpectedly, we find that enhancer transcription precedes local mono- and dimethylation of histone H3 lysine 4 (H3K4me1/2). H3K4 methylation at de novo enhancers is primarily dependent on the histone methyltransferases Mll1, Mll2/4, and Mll3 and is significantly reduced by inhibition of RNA polymerase II elongation. Collectively, these findings suggest an essential role of enhancer transcription in H3K4me1/2 deposition at de novo enhancers that is independent of potential functions of the resulting eRNA transcripts.


Figures

Figure 1
Figure 1. TLR4-induced remodeling of the macrophage enhancer landscape
(A) Heat map of normalized tag densities for the H3K4me2-MNase histone mark at inter- and intragenic de novo enhancers. Two kb regions are shown centered at the midpoints of the nucleosome free regions (NFR). (B) UCSC genome browser images for Ptges and Irg1 enhancers ~10 kb upstream of the TSS of the coding genes. Normalized tag counts for the indicated features are shown under no treatment (Notx) and 6h KLA stimulation. The region of de novo enhancer formation upstream of Irg1 is highlighted in yellow. See also Figure S1E. (C) Heat map of normalized tag densities for the H3K4me2-MNase histone mark at inter- and intragenic enhancers lost upon KLA-stimulation. Two kb regions are shown centered at the midpoints of the NFRs. (D) Box-and-whisker plots of the fold change in expression of genes located < 100 kB from the gained, lost or common enhancers. Boxes encompass the 25th to 75th % changes. Whiskers extend to 10th and 90th percentiles. The median fold change is indicated by the central horizontal bar and the mean fold change upon 1h KLA-treatment is indicated by +. (E and F) Sequence motifs associated with (E) de novo and (F) lost H3K4me2-marked enhancers. See also Figure S1.
Figure 2
Figure 2. Mechanisms of de novo enhancer assembly
(A) Heat maps of PU.1, p65, and C/EBPα binding and deposition of H3K27ac at de novo enhancers as a function of time following KLA treatment. (B) Distance relationship between p65 and PU.1 or C/EBPα peaks at de novo enhancers exhibiting p65 binding upon 1h KLA treatment. (C) Box-and-whisker plots of the fold change in expression of genes located < 100 kB from the C/EBPα and PU.1 peaks gained, lost or exhibiting no change upon 1h KLA stimulation. Data is plotted as shown in Figure 1D. (D) Effect of 1 h pretreatment of macrophages with an IKK inhibitor (30 μM) on the profile of H3K4me2-MNase ChIP-Seq tags around de novo and lost enhancers. See also Figures S2A and S2B. (E) Role of PU.1 in TLR4-dependent gene activation. PU.1−/− hematopoietic progenitors gain macrophage phenotype by the expression of tamoxifen- activatable PU.1 protein. Upon 1h KLA-stimulation 317 genes are induced in PUER cells whereas only 92 of these genes are induced in PU.1−/− cells (Fold change >2, RPKM> 0.5, FDR<0.01). See also Figure S2C. (F) ChIP assay of p65 enrichment at PU1-dependent and PU1-independent (green background) enhancers quantified by ChIP-qPCR in PU.1−/− and in PUER cells treated with tamoxifen for 24 hours with or without KLA. Relative Enrichment for ratio of KLA/Notx is presented. The enhancer is associated to the nearest expressed gene if it is < 100 kb away from the amplicon location, otherwise the center position of the amplicon in the genome is indicated. Relative enrichments are representative of individual experiments performed in duplicate.
Figure 3
Figure 3. Relationship between eRNA expression and deposition of H4K5ac and H3K4me2
(A) Hierarchical clustering and heat map of the fold change in eRNA and coding gene expression (eRNAs: RPKM>1, genes: FDR 0.01, RPKM>0.5). See also Figure S3A–S3D. (B) Heat maps of normalized tag densities for GRO-Seq around 2 kb of de novo enhancers centered to nucleosome free regions as a function of time following KLA treatment. (C) Temporal profile of H4K5ac normalized tag densities tag counts around 2 kb of de novo enhancers as a function of time following KLA treatment. See also Figure S3E–S3G. (D) Distribution of GRO-Seq tags at around NFRs at de novo H3K4me2-associated enhancers as a function of time following KLA treatment. (E) Temporal profile of change in H3K4me2-MNase ChIP-Seq tags at de novo enhancers following KLA treatment. See also Figure S3H. (F) Coverage of H3K4me1 ChIP-Seq tags at de novo enhancers following LPS treatment (Ostuni et al., 2013). (G) Heat map comparing the distribution of intergenic H3K4me1 and H3K4me2 regions and GRO-Seq signal. Pre-existing H3K4me2 regions centered to NFR are presented. See also Figure S3I. (H) Comparison of GRO-Seq and H3K4me2 cumulative tag densities at enhancers characterized by exclusive unidirectional eRNA initiation from minus (left) or plus (strands). GRO-Seq signal is multiplied by ten compared to H3K4me2 signal.
Figure 4
Figure 4. IBET151 and flavopiridol decrease mRNA and eRNA elongation without affecting H4K8ac levels
(A) Distribution of average GRO-Seq tag densities on the + strand around the TSS of KLA- induced genes subject to inhibition by IBET151 or flavopiridol (Flavo) pretreatment (1 μM). (B) UCSC Genome browser image depicting normalized GRO-Seq tag counts at Ccl5 coding gene in KLA-stimulated cells pretreated or not with Flavopiridol or IBET151 inhibitor for 1h. (C) The Gene Pause Ratio (upper figure) was defined as the ratio of strand-specific GRO-Seq tag density found within the proximal promoter (a = −25 bp to +175 bp) to the GRO-Seq tag density found at the gene body (b = +175 to end of the gene). The Enhancer Pause Ratio (lower figure) was calculated as the ratio of GRO-Seq tag density found within the proximal enhancer region (a = +/− 250 bp) to the GRO-Seq tag density found at the distal enhancer region (b1/2= +/− 250 bp to +/− 1250 bp). (D) Scatter plot of mRNA Pause Ratios comparing KLA-stimulated control to IBET151-pretreated (left) or Flavopiridol pretreated samples. KLA-induced genes exhibiting promoter RPKM > 2 were included in the analysis. (E) Scatter plot of the change in enhancer Pause Ratios comparing KLA-stimulated control to IBET151-pretreated (left) or Flavopiridol pretreated samples. De novo enhancers exhibiting >1.5-induction in eRNA level and RPKM > 0.5 were included in the analysis. See also Figure S4. (F) Heat maps of normalized tag densities for H4K8ac ChIP-Seq and GRO-Seq around 2 kb of de novo enhancers in KLA-stimulated control and IBET151 or Flavopiridol (FP) pretreated samples
Figure 5
Figure 5. Inhibition of eRNA elongation prevents deposition of H3K4me2
(A) Effect of IBET151 and flavopiridol pretreatment on the profile of H3K4me2-MNase ChIP-Seq tags around de novo enhancers which exhibit > 1.5-fold drug-induced decrease in eRNA induction. (B) UCSC genome browser images for Irg1 and Ptges enhancers. Normalized tag counts for GRO-Seq (1h) H4K8ac ChIP-Seq (1h) and H3K4me2 MNase ChIP-Seq (6h) in KLA-stimulated macrophages pretreated with IBET151 or Flavopiridol. See also Figure S5A. (C) Scatter plots depicting the relationship between the fold change in GRO-Seq tag count and H3K4me2-MNAse ChIP-Seq tag count at de novo enhancers. Enhancers with GRO-Seq RPKM levels above 1 within de novo enhancer regions were included in the analysis. Pearson correlation values (r) are also shown: *** p<0.0001, **p=0.0012. See also S5B. (D) Heat maps of normalized tag densities for GRO-Seq around 2 kb of de novo enhancers in KLA-stimulated control and α-amanitin (a-Ama), actinomycin D (ActD) and triptolide pretreated samples. Data are presented as mean ± SD. See also S5D and S5E. (E) Fold change in eRNA expression and H3K4me1/2 deposition at Irg1, Ifnar2, Socs3 and Ptges de novo enhancers quantified by GRO-Seq (1h) or ChIP-qPCR (6h) in KLA-stimulated macrophages pretreated with transcriptional inhibitors. Data are presented as mean ± SD. *P<0.05 versus KLA treated. See also S5F.
Figure 6
Figure 6. Mll-family of histone methylatransferases are responsible for the deposition of H3K4me1/2
(A) Box-and-whisker plots of the fold change in H3K4me1 ChIP-Seq tags at de novo enhancers compared to control siRNA treated sample upon 6h KLA treatment. Data is plotted as shown in Figure 1D. Student’s paired 2-tailed t-test, only P<1E-100 = *** are shown. See also S6A. (B) Distribution of average H3K4me1 tag densities on the around the NFR-centered de novo enhancers with indicated siRNA treatments. (C) Box-and-whisker plots of the fold change in H3K4me2 ChIP-Seq tags at de novo enhancers compared to control siRNA treated sample upon 6h KLA treatment. Data is plotted as shown in Figure 1D. Student’s paired 2-tailed t-test, P<1E-100 = *** are shown. See also S6B and S6C. (D) Profile of H3K4me2-MNase ChIP-Seq tags around de novo after the indicated siRNA treatments. (E) UCSC Genome browser image depicting normalized H3K4me1 and H3K4me2 ChIP-Seq tag counts upstream of Irg1 gene in KLA-stimulated cells pretreated or not with siRNAs against the indicated histone methyltransferases. De novo enhancers are highlighted in yellow. See also S6D. (F) Scatter plot of fold change in H3K4me2 ChIP-Seq tags comparing KLA-stimulated control siRNA (siCtl) and siRNAs against Mll1 and Mll3. Pearson correlation values (r) are shown in red.
Figure 7
Figure 7. eRNA transcription reflects functionality of enhancers
(A) UCSC Genome browser image showing the normalized H3K4me2-MNase ChIP-Seq and GRO-Seq tag densities at Ccl9 and Klf7 enhancer. See also ure S7. (B) Heat map of normalized tag densities for GRO-Seq and H3K27me3 ChIP-Seq 2 kB around the nucleosome-free regions of basal intergenic enhancers. (C) Heat-map of normalized GRO-seq reads (RPKM) at enhancers exhibiting no eRNA expression in thioglycollate elicited macrophages (TGEM) and at the associated genes compared to myeloid progenitor cells (PUER) and bone marrow derived macrophages (BMDM). (D) The enhancers with highest (quartile 1) and lowest (quartile 4) eRNA expression in B were associated with expression of the nearest genes. The plot illustrates a cumulative percentage histogram of genes based on their normalized expression level (RPKM). (E) Model for de novo enhancer assembly. See discussion for details.

Similar articles

Cited by

References

    1. Barish GD, Yu RT, Karunasiri M, Ocampo CB, Dixon J, Benner C, Dent AL, Tangirala RK, Evans RM. Bcl-6 and NF-kappaB cistromes mediate opposing regulation of the innate immune response. Genes & development. 2010;24:2760–2765. - PMC - PubMed
    1. Bennett CF, Swayze EE. RNA targeting therapeutics: molecular mechanisms of antisense oligonucleotides as a therapeutic platform. Annual review of pharmacology and toxicology. 2010;50:259–293. - PubMed
    1. Bhatt DM, Pandya-Jones A, Tong AJ, Barozzi I, Lissner MM, Natoli G, Black DL, Smale ST. Transcript dynamics of proinflammatory genes revealed by sequence analysis of subcellular RNA fractions. Cell. 2012;150:279–290. - PMC - PubMed
    1. Biddie SC, John S, Sabo PJ, Thurman RE, Johnson TA, Schiltz RL, Miranda TB, Sung MH, Trump S, Lightman SL, et al. Transcription factor AP1 potentiates chromatin accessibility and glucocorticoid receptor binding. Mol Cell. 2011;43:145–155. - PMC - PubMed
    1. Bonn S, Zinzen RP, Girardot C, Gustafson EH, Perez-Gonzalez A, Delhomme N, Ghavi-Helm Y, Wilczynski B, Riddell A, Furlong EE. Tissue-specific analysis of chromatin state identifies temporal signatures of enhancer activity during embryonic development. Nature Genetics. 2012;44:148–156. - PubMed

Publication types

MeSH terms

Associated data