. 2013 Nov-Dec;68(3):323-33.
doi: 10.1016/j.vascn.2013.07.005. Epub 2013 Aug 9.

Label-free cell phenotypic assessment of the biased agonism and efficacy of agonists at the endogenous muscarinic M3 receptors

Affiliations

Label-free cell phenotypic assessment of the biased agonism and efficacy of agonists at the endogenous muscarinic M3 receptors

Huayun Deng et al. J Pharmacol Toxicol Methods. 2013 Nov-Dec.

Abstract

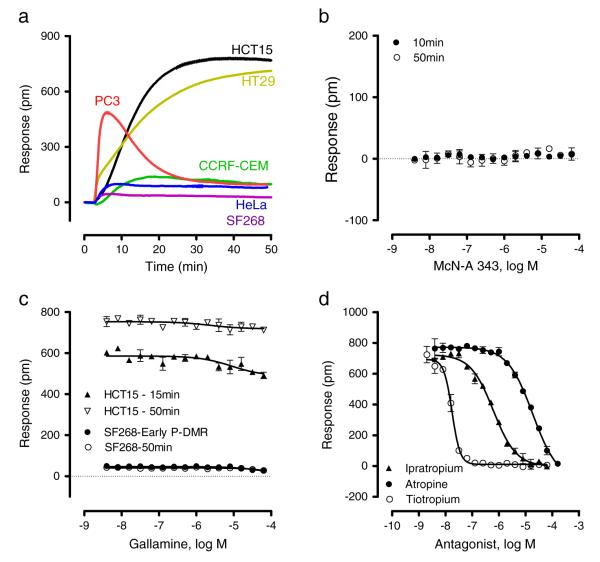
Introduction: Efficacy describes the property of a ligand that enables the receptor to change its behavior towards the host cell, while biased agonism defines the ability of a ligand to differentially activate some of the vectorial pathways over others mediated through the receptor. However, little is known about the molecular basis defining the efficacy of ligands at G protein-coupled receptors. Here we characterize the biased agonism and cell phenotypic efficacy of seven agonists at the endogenous muscarinic M3 receptors in six different cell lines including HT-29, PC-3, HeLa, SF268, CCRF-CEM and HCT-15 cells.

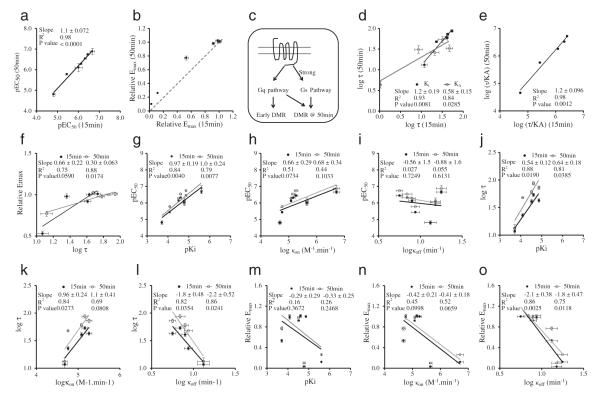
Methods: Quantitative real-time PCR and multiple label-free whole cell dynamic mass redistribution (DMR) assays were used to determine the functional muscarinic receptors in each cell line. DMR pathway deconvolution assay was used to determine the pathway biased activity of the muscarinic agonists. Operational agonism model was used to quantify the pathway bias, while macro-kinetic data reported in literature was used to analyze the biochemical mechanism of action of these agonists.

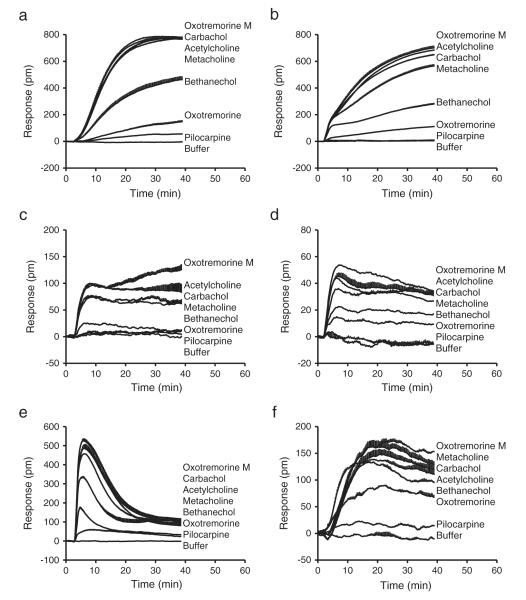
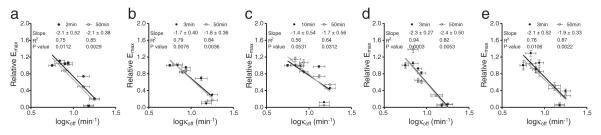
Results: Quantitative real-time PCR and ligand pharmacology studies showed that all the native cell lines endogenously express functional M3 receptors. Furthermore, different agonists triggered distinct DMR signals in a specific cell line as well as in different cell lines. DMR pathway deconvolution using known G protein modulators revealed that the M3 receptor in all the six cell lines signals through multiple G protein-mediated pathways, and certain agonists display biased agonism in a cell line-dependent manner. The whole cell efficacy and potency of these agonists were found to be sensitive to the assay time as well as the cell background. Correlation analysis suggested that the whole cell efficacy of agonists is correlated well with their macro-dissociation rate constants.

Discussion: This study implicates that the endogenous M3 receptors are coupled to multiple pathways, and the muscarinic agonists can display distinct biased agonism and whole cell phenotypic efficacy.

Keywords: Biased agonism; DMR; Drug residence time; Dynamic mass redistribution; Efficacy; G protein-coupled receptor; GPCR; HBSS; Hanks' balanced salt solution; Muscarinic M(3) receptor; RT-PCR; RWG; dynamic mass redistribution; real time polymerase chain reaction; resonant waveguide grating.


Figures

Fig. 1
Fig. 1
Chemical structures of seven muscarinic receptor agonists examined.
Fig. 2
Fig. 2
Characterization of functional muscarinic receptor subtypes in the six native cell lines. (a) The DMR signals of 16 μM acetylcholine in these cell lines; (b) The DMR dose responses of McN-A-343 in HCT-15; (c) The dose-dependent effect of gallamine on the DMR of 4 μM acetylcholine in SF268 (the maximal amplitudes within 10 min, “early P-DMR”, or the amplitudes at 50 min post stimulation) or HCT-15 cells (the amplitudes at 15 min or 50 min post stimulation); (d) The dose-dependent inhibition of three antagonists on the DMR amplitudes at 50 min post stimulation with 4 μM acetylcholine in HCT-15 cells. Data represents mean ± s.d (n = 16 for a, n = 4 for b to d).
Fig. 3
Fig. 3
The real-time DMR of muscarinic receptor agonists in the six different cell lines. The agonist doses, each at its 1× EC100, were 16 μM, 32 μM, 64 μM, 32 μM, 64 μM, 8 μM, and 8 μM in HCT-15 cells (a); 16 μM, 32 μM, 64 μM, 16 μM, 64 μM, 8 μM, and 64 μM in HT-29 cells (b); 16 μM, 8 μM, 32 μM, 32 μM, 32 μM, 32 μM, and 32 μM in HeLa cells (c); 32 μM, 8 μM, 32 μM, 16 μM, 32 μM, 8 μM and 64 μM in SF268 cells (d); 16 μM, 16 μM, 64 μM, 32 μM, 64 μM, 16 μM and 64 μM in PC3 cells (e); 16 μM, 16 μM, 64 μM, 32 μM, 64 μM, 16 μM, and 32 μM in CCRF-CEM cells (f) for oxotremorine M, acetylcholine, carbachol, metacholine, bethanechol, oxotremorine, and pilocarpine, respectively. Data represents mean ± s.d. (n = 16).
Fig. 4
Fig. 4
Time-dependent potency of muscarinic receptor agonists in different cell lines. (a, b) HCT-15; (c, d) HT-29; (e, f) CCRF-CEM; (g, h) PC3. Data represents mean ± s.d. (n = 4).
Fig. 5
Fig. 5
Pathway biased agonism of muscarinic receptor agonists in HCT-15 cells. (a) 16 μM acetylcholine; (b) 16 μM oxotremorine M; (c) 64 μM carbachol; (d) 32 μM methacholine; (e) 64 μM bethanechol; (f) 16 μM oxotremorine; (g) 64 μM pilocarpine. Data represents mean ± s.d. (n = 4). (h) One-way ANOVA followed by Tukey’s multiple comparison test of the maximal DMR of different agonists in the QIC-treated cells.
Fig. 6
Fig. 6
Dose-dependent DMR responses at 50 min post stimulation of the seven agonists in the six different cell lines. (a) HCT-15; (b) HT-29; (c) HeLa; (d) SF268; (e) PC3; (f) CCRF-CEM cells. Data represents mean ± s.d. (n = 4).
Fig. 7
Fig. 7
Correlation analysis of muscarinic receptor agonists in HCT-15 cells. (a) The relation between pEC50 at 15 min and 50 min poststimulation. (b) The relation between the relative maxima at 15 min and 50 min poststimulation. (c) Schematic drawing showing distinct pathways contributing differently to the early and late DMR, respectively, with a stronger coupling efficiency towards the late response. (d) The relation between the τ values at 15 min and 50 min poststimulation; wherein the τ values were obtained based on the reported Ki values or the data fitting derived KA values. (e) The relation between the log (τ / KA) values at 15 min and 50 min. (f) The relation between log (τ) and relative maxima. (g) The relation between pKi and pEC50. (h) The relation between log (kon) and pEC50. (i) The relation between log (koff) and pEC50. (j) The relation between pKi and log (τ). (k) The relation between log (Kon) and log (τ). (l) The relation between log (koff) and log (τ). (m) The relation between pKi and relative maxima. (n) The relation between log (kon) and relative maxima. (o) The relation between log (koff) and relative maxima. Data represents mean ± s.d. (n = 4). The p (probability) value for determining the slope if it is significantly non-zero was calculated using linear regression with Prism. A p-value below 0.05 means that the difference is statistically significant. All pKi, Kon and Koff values were obtained from Sykes et al. (2009).
Fig. 8
Fig. 8
Relation between relative maxima and log (Koff) values of muscarinic receptor agonists in different cell lines. (a) HT-29; (b) PC3; (c) CCRF-CEM; (d) SF268; (e) HeLa cells. Data represents mean ± s.d. (n = 4). The p (probability) value for determining the slope if it is significantly non-zero was calculated using linear regression with Prism. A p-value below 0.05 means that the difference is statistically significant. All pKi, Kon and Koff values were obtained from Sykes et al. (2009).

Similar articles

Cited by

References

    1. Black JW, Leff P. Operational models of pharmacological agonism. Proceedings of the Royal Society B: Biological Sciences. 1983;220:141–162. - PubMed
    1. Boehr DD, Nussinov R, Wright PE. The role of dynamic conformational ensembles in biomolecular recognition. Nature Chemical Biology. 2009;5:789–796. - PMC - PubMed
    1. Calebiro D, Nikolaev VO, Persani L, Lohse MJ. Signaling by internalized G-protein-coupled receptors. Trends in Pharmacological Sciences. 2010;31:221–228. - PubMed
    1. Casarosa P, Bouyssou T, Germeyer S, Schnapp A, Gantner F, Pieper M. Pre-clinical evaluation of long-acting muscarinic antagonists: comparison of tiotropium and investigational drugs. The Journal of Pharmacology and Experimental Therapeutics. 2009;330:660–668. - PubMed
    1. Caulfield MP, Birdsall NJ. International Union of Pharmacology. XVII. Classi-fication of muscarinic acetylcholine receptors. Pharmacological Reviews. 1998;50:279–290. - PubMed

Publication types

LinkOut - more resources