. 2013 Dec 5;381(1-2):175-87.
doi: 10.1016/j.mce.2013.07.033. Epub 2013 Aug 7.

Tianeptine interferes with microtubule organization and hormone secretion of pheochromocytoma cells

Affiliations

Tianeptine interferes with microtubule organization and hormone secretion of pheochromocytoma cells

Vishruti Makani et al. Mol Cell Endocrinol. .

Abstract

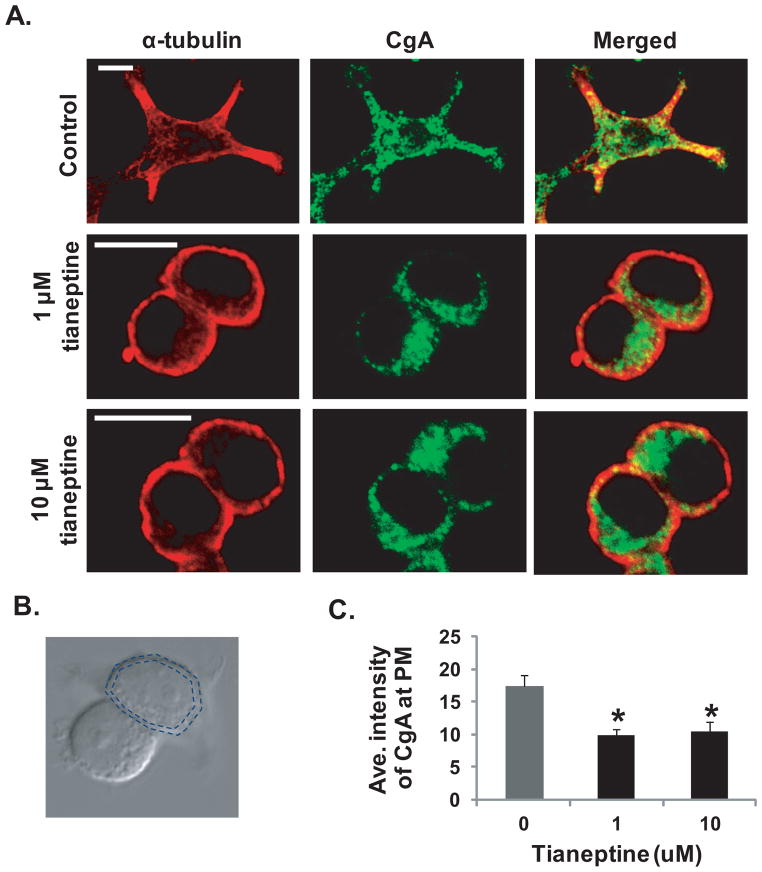
Pheochromocytoma originates from chromaffin cells in the adrenal medulla and sympathetic paraganglia. 36-53% of pheochromocytoma becomes malignant and, thereafter, resistant to conventional treatments. Pheochromocytoma also causes hyper-secretion of catecholamines that cause severe hypertension. We found that an antidepressant, tianeptine, interfered with normal life cycle of pheochromocytoma cells at its clinical doses. Treatment with tianeptine caused microtubule bundling and specific degradation of cytoplasmic dynein, a retrograde microtubule motor that mediates various microtubule-dependent processes during interphase and mitosis, in the rat pheochromocytoma PC12 cells. Tianeptine also increased the levels of pro-apoptotic proteins, slowed cell cycle progression, and increased apoptosis in PC12 cells. Importantly, tianeptine treatment decreased high K(+)-stimulated secretion of norepinephrine and chromogranin A in PC12 cells and of epinephrine in the mouse pheochromocytoma MPC cells. Our study demonstrates, for the first time, that tianeptine interferes with normal life cycle of pheochromocytoma cells.

Keywords: Cytoplasmic dynein; Microtubule bundling; Pheochromocytoma; Tianeptine.


Figures

Fig. 1
Fig. 1
Tianeptine causes microtubule bundling in PC12 cells. (A–D) PC12 cells were treated with mock (A), 1 μM (B), 10 μM (C), or 100 μM (D) of tianeptine for 18 h and immunostained using anti-α-tubulin antibody. Scale bars = 10 μm. (E–H) PC12 cells were treated with mock (E), 1 μM (F), 10 μM (G), or 100 μM (H) of tianeptine twice at a 12-h interval for 24 h and immunostained using anti-α-tubulin antibody. Scale bars = 10 μm. (I & J) Bar graphs showing the average percents of cells showing bundled microtubules after 18-h × 1 (I) and 12-h × 2 (J) tianeptine treatment. Three independent experiments (80 cells per experiment) were performed to obtain the mean percent of cells and standard error of mean (SEM). * p<0.001 compared to control.
Fig. 2
Fig. 2
Tianeptine interferes with the re-formation of interphase microtubule network. (A) PC12 cells were treated with mock, 1, 10, or 100 μM of tianeptine for 18 h prior to nocodazole (33 μM) treatment for 2 h at 37°C. After nocodazole was washed out, cells were incubated in nocodazole-free medium at 37°C for 0–60 min to induce microtubule regrowth. Microtubules were stained using anti-α-tubulin antibody. Scale bars = 10 μm. (B) Bar graphs showing the average percents of cells with bundled microtubules at 60 min after nocodazole washout. Bar graphs represent mean ± SEM of three independent experiments (* p<0.001 compared to control).
Fig. 3
Fig. 3
Bundled microtubules in tianeptine-treated cells are resistant to cold-induced depolymerization. PC12 cells treated with mock (A) or 100 μM tianeptine (B) for 18 h were incubated on ice for 0–30 min. Microtubules were stained using anti-α-tubulin antibody. Scale bars = 5 μm. (C) The average intensities of immunostained microtubules at the cell periphery were quantified using Metamorph software. Results represent mean ± SEM of three independent experiments (* p<0.001). (D) Microtubules were polymerized in the cell cytosols added with mock, 20 μM paclitaxel, or 50 μM tianeptine. Polymerized microtubules were pelleted and free tubulins remained in the supernatant after ultracentrifugation. Tubulins in the pellet (P) and supernatant (S) were detected by immunoblotting.
Fig. 4
Fig. 4
Tianeptine causes rapid and specific reduction of cytoplasmic dynein. PC12 cells were treated with mock, 1, 10, or 100 μM tianeptine for 18 h. Cell cytosols were processed for immunoblotting using antibodies to dynein intermediate chain (DIC), dynactin side arm (p150), and anti-α-tubulin (A). The band densities of cytoplasmic dynein (DIC) and dynactin (p150) on immunoblots were quantified using Image J software. Data represents the relative levels of cytoplasmic dynein (B) and dynactin (C) to α-tubulin. Results represent mean ± SEM of three independent experiments (* p<0.05, ** p<0.01, *** p<0.001). (D–E) PC12 cells transfected with GFP tag alone (D) or GFP-tagged dynamitin (p50) (E) were immunostained with anti-α-tubulin antibody. Scale bars = 5 μm.
Fig. 5
Fig. 5
Tianeptine has a pro-apoptotic effect on PC12 cells. PC12 cells treated with none (A) or 100 μM tianeptine (B) were permeabilized with 0.1% Tx-100 and immunostained with anti-lamin-B1 antibody. Scale bar = 5 μm. (C) Bar graphs showing the average percent (±SEM) of cells with lamin-B1 aggregation. (D–F) PC12 cells were treated with mock, 1, or 10 μM tianeptine for 18 h and processed for immunoblotting using anti-p53, anti-p27, and anti-α-tubulin antibodies. The protein levels of p53 and p27 were quantified using Image J software. Bar graphs represent the relative levels of p53 (E) and p27 (F) to α-tubulin. (G) Bar graphs show the percents of PC12 cells treated with mock or 1 μM tianeptine in G2/M phase after 48-h post-release. (H, I) The percentage of dead cells in PC12 cells treated with mock or 1 μM tianeptine for 48 h was quantified by FACS. Histograms show the numbers of cells positive for propidium iodide (PI) staining. Cells stained with PI were counted as dead cells. All of the above experiments were repeated three times and the results were presented as mean ± SEM (* p<0.05, ** p<0.01).
Fig. 6
Fig. 6
Tianeptine treatment decreases stimulated secretion of chromogranin A (CgA) and norepinephrine. PC12 cells were treated with mock, 1, or 10 μM tianeptine for 18 h and incubated in serum-free DMEM for 30 min twice for basal releases (B). The basal releases were followed by 30-min stimulation with DMEM containing 50 mM KCl and 2 mM BaCl2 (S: stimulated secretion). (A) Representative immunoblots show basal and stimulated CgA secretion in cells treated with mock, 1, or 10 μM tianeptine. CgA levels in basal and stimulated secretions were quantified using densitometry (Image J software). (B) Bar graphs show the average fold changes in stimulated CgA secretion in mock, 1, or 10 μM tianeptine-treated cells. (C, D) PC12 cells treated with mock, 1 or 10 μM tianeptine were examined for stimulated secretion of norepinephrine and epinephrine using ELISA assay. Bar graphs represent the amounts of norepinephrine (C) and epinephrine (D) in stimulated secretions. The results are expressed as mean ± SEM of three independent experiments (* p<0.05).
Fig. 7
Fig. 7
Tianeptine treatment decreases the localization of CgA-containing vesicles to the proximity of the plasma membrane. PC12 cells were treated with mock, 1 or 10 μM tianeptine for 24 h and immunostained with antibodies to α-tubulin and chromogranin A (CgA). (A) Representative confocal images of α-tubulin (red) and CgA (green) in cells treated with mock, 1, or 10 μM tianeptine. Scale bar = 10 μm. The average intensity of CgA staining within ~300 nm from the plasma membrane (PM) was measured using Metamorph software (B). (C) The bar graphs show the average intensities ± SEM of CgA at the PM (~100 cells per condition in three independent experiments, * p<0.05).
Fig. 8
Fig. 8
Tianeptine decreases epinephrine secretion and cytoplasmic dynein and increases p53 in MPC cells. (A) Mouse pheochromocytoma MPC cells treated with mock, 1 or 10 μM tianeptine were examined for stimulated secretion of norepinephrine and epinephrine using ELISA assay. Bar graphs show the amounts (mean ± SEM) of norepinephrine and epinephrine in stimulated secretion in three independent experiments (* p<0.05). (B) MPC cells were treated with mock, 1, or 10 μM tianeptine for 24 h and processed for immunoblotting using anti-dynein (DIC), anti-p53, anti-dynactin (p150), anti-β-actin, and anti-α-tubulin antibodies. β-actin and α-tubulin were examined as loading controls. The protein levels were quantified using Image J software (C–E). Bar graphs represent the relative protein levels of DIC (C), p53 (D) and p150 (E) to α-tubulin. The data were expressed as mean ± SEM of the relative protein levels in three different experiments (* p<0.05). (F) MPC cells were fixed in −20°C methanol and immunostained with α-tubulin antibody. A representative image of clustered MPC cells (D.I.C.: differential interference contrast; α-tubulin staining on the right).

Similar articles

References

    1. Adjalle R, Plouin PF, Pacak K, Lehnert H. Treatment of malignant pheochromocytoma. Horm Metab Res. 2009;41:687–96. - PMC - PubMed
    1. Adler JT, Meyer-Rochow GY, Chen H, Benn DE, Robinson BG, Sippel RS, Sidhu SB. Pheochromocytoma: current approaches and future directions. Oncologist. 2008;13:779–93. - PubMed
    1. Ahlman H. Malignant pheochromocytoma: state of the field with future projections. Ann N Y Acad Sci. 2006;1073:449–64. - PubMed
    1. Amar L, Baudin E, Burnichon N, Peyrard S, Silvera S, Bertherat J, Bertagna X, Schlumberger M, Jeunemaitre X, Gimenez-Roqueplo AP, et al. Succinate dehydrogenase B gene mutations predict survival in patients with malignant pheochromocytomas or paragangliomas. J Clin Endocrinol Metab. 2007;92:3822–8. - PubMed
    1. Aonuma M, Miyamoto M, Inoue YH, Tamai K, Sakai H, Kamasawa N, Matsukage A. Microtubule bundle formation and cell death induced by the human CLASP/Orbit N-terminal fragment. Cell Struct Funct. 2005;30:7–13. - PubMed

Publication types

MeSH terms