

New regulatory circuit controlling spatial and temporal gene expression in the sea urchin embryo oral ectoderm GRN
- PMID: 23933172
- PMCID: PMC3783610
- DOI: 10.1016/j.ydbio.2013.07.027
New regulatory circuit controlling spatial and temporal gene expression in the sea urchin embryo oral ectoderm GRN
Abstract
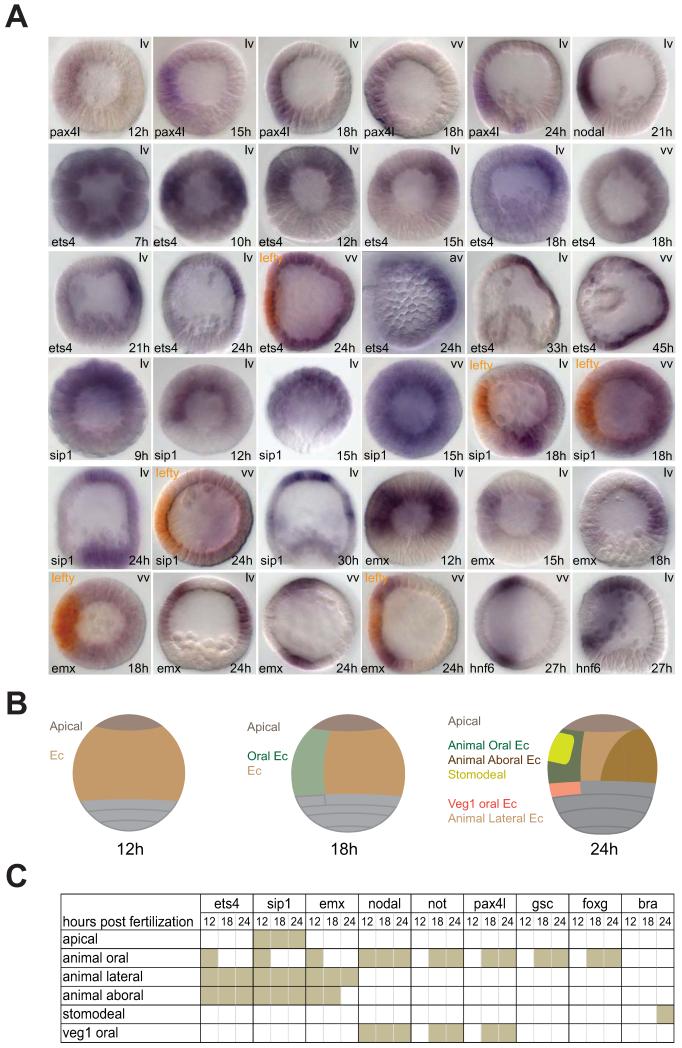
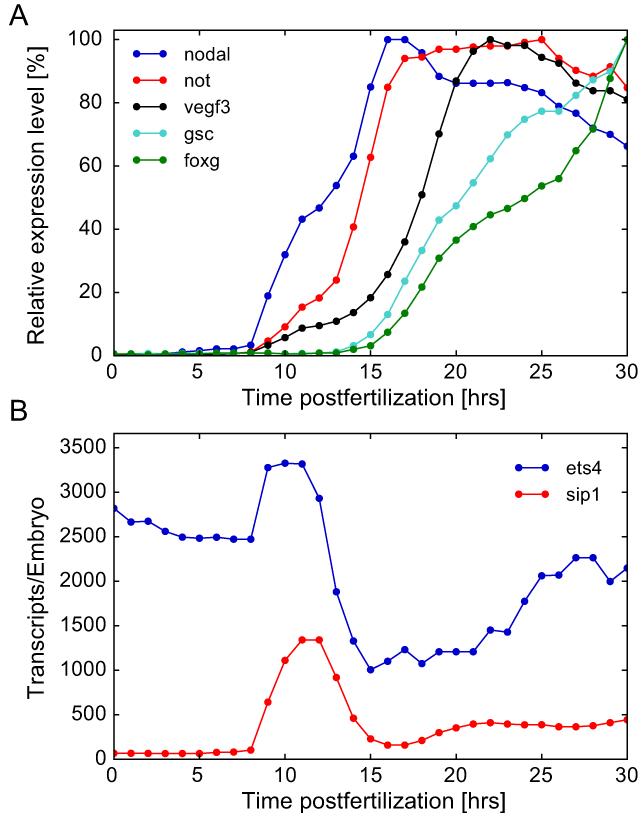
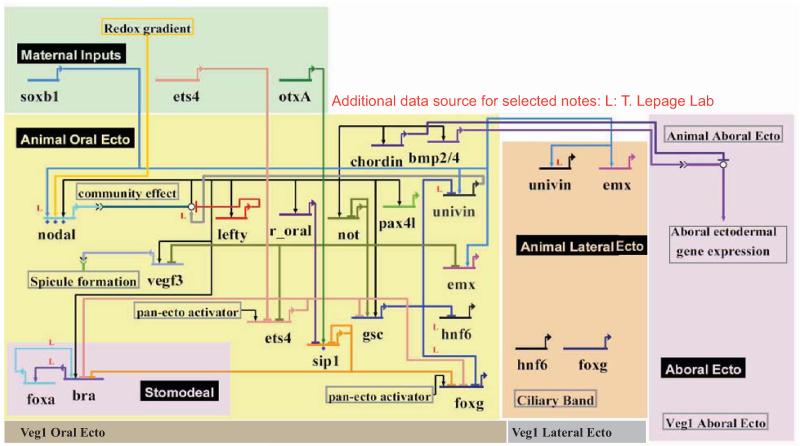
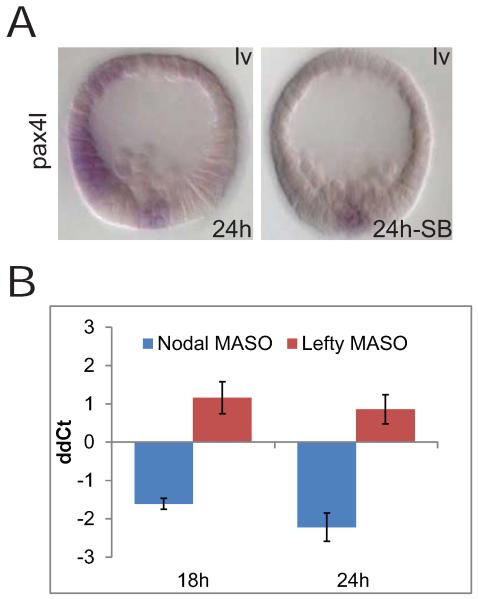
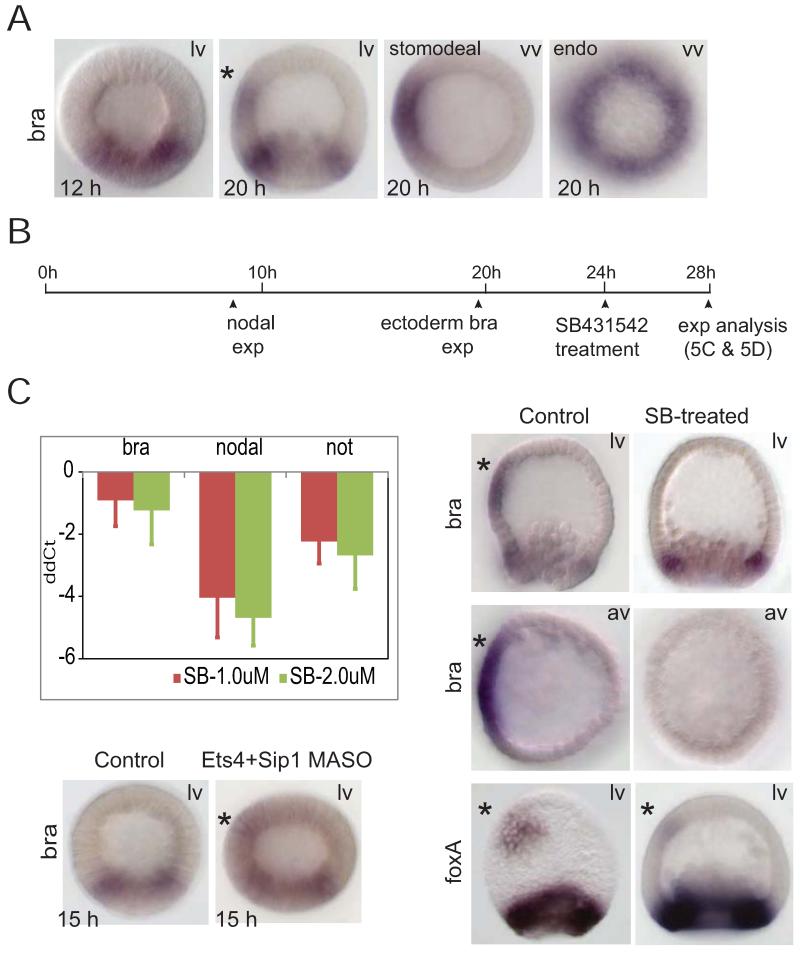
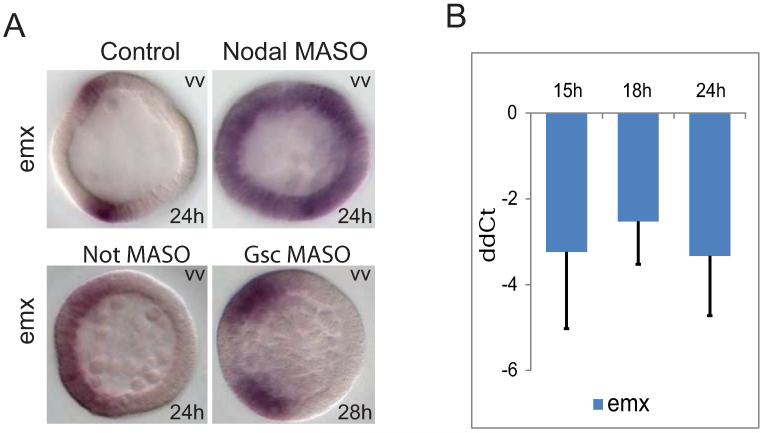
The sea urchin oral ectoderm gene regulatory network (GRN) model has increased in complexity as additional genes are added to it, revealing its multiple spatial regulatory state domains. The formation of the oral ectoderm begins with an oral-aboral redox gradient, which is interpreted by the cis-regulatory system of the nodal gene to cause its expression on the oral side of the embryo. Nodal signaling drives cohorts of regulatory genes within the oral ectoderm and its derived subdomains. Activation of these genes occurs sequentially, spanning the entire blastula stage. During this process the stomodeal subdomain emerges inside of the oral ectoderm, and bilateral subdomains defining the lateral portions of the future ciliary band emerge adjacent to the central oral ectoderm. Here we examine two regulatory genes encoding repressors, sip1 and ets4, which selectively prevent transcription of oral ectoderm genes until their expression is cleared from the oral ectoderm as an indirect consequence of Nodal signaling. We show that the timing of transcriptional de-repression of sip1 and ets4 targets which occurs upon their clearance explains the dynamics of oral ectoderm gene expression. In addition two other repressors, the direct Nodal target not, and the feed forward Nodal target goosecoid, repress expression of regulatory genes in the central animal oral ectoderm thereby confining their expression to the lateral domains of the animal ectoderm. These results have permitted construction of an enhanced animal ectoderm GRN model highlighting the repressive interactions providing precise temporal and spatial control of regulatory gene expression.
Keywords: Gene regulatory network; Oral ectoderm; Sea urchin; ets4; sip1.
© 2013 Elsevier Inc. All rights reserved.
Figures
Similar articles
-
The dynamic gene expression patterns of transcription factors constituting the sea urchin aboral ectoderm gene regulatory network.Dev Dyn. 2011 Jan;240(1):250-60. doi: 10.1002/dvdy.22514. Dev Dyn. 2011. PMID: 21181943
-
Encoding regulatory state boundaries in the pregastrular oral ectoderm of the sea urchin embryo.Proc Natl Acad Sci U S A. 2014 Mar 11;111(10):E906-13. doi: 10.1073/pnas.1323105111. Epub 2014 Feb 20. Proc Natl Acad Sci U S A. 2014. PMID: 24556994 Free PMC article.
-
Oral-aboral patterning and gastrulation of sea urchin embryos depend on sulfated glycosaminoglycans.Mech Dev. 2011 Jan-Feb;128(1-2):71-89. doi: 10.1016/j.mod.2010.11.001. Epub 2010 Nov 5. Mech Dev. 2011. PMID: 21056656
-
Gene regulatory networks for ectoderm specification in sea urchin embryos.Biochim Biophys Acta. 2009 Apr;1789(4):261-7. doi: 10.1016/j.bbagrm.2009.02.002. Epub 2009 Mar 21. Biochim Biophys Acta. 2009. PMID: 19429544 Review.
-
A conserved role for the nodal signaling pathway in the establishment of dorso-ventral and left-right axes in deuterostomes.J Exp Zool B Mol Dev Evol. 2008 Jan 15;310(1):41-53. doi: 10.1002/jez.b.21121. J Exp Zool B Mol Dev Evol. 2008. PMID: 16838294 Review.
Cited by
-
Geometric control of ciliated band regulatory states in the sea urchin embryo.Development. 2015 Mar 1;142(5):953-61. doi: 10.1242/dev.117986. Epub 2015 Feb 5. Development. 2015. PMID: 25655703 Free PMC article.
-
Early asymmetric cues triggering the dorsal/ventral gene regulatory network of the sea urchin embryo.Elife. 2014 Dec 2;3:e04664. doi: 10.7554/eLife.04664. Elife. 2014. PMID: 25457050 Free PMC article.
-
Feedback circuits are numerous in embryonic gene regulatory networks and offer a stabilizing influence on evolution of those networks.Evodevo. 2023 Jun 16;14(1):10. doi: 10.1186/s13227-023-00214-y. Evodevo. 2023. PMID: 37322563 Free PMC article.
-
Genome-wide assessment of differential effector gene use in embryogenesis.Development. 2015 Nov 15;142(22):3892-901. doi: 10.1242/dev.127746. Epub 2015 Sep 28. Development. 2015. PMID: 26417044 Free PMC article.
-
BMP controls dorsoventral and neural patterning in indirect-developing hemichordates providing insight into a possible origin of chordates.Proc Natl Acad Sci U S A. 2019 Jun 25;116(26):12925-12932. doi: 10.1073/pnas.1901919116. Epub 2019 Jun 12. Proc Natl Acad Sci U S A. 2019. PMID: 31189599 Free PMC article.
References
-
- Cameron RA, Hough-Evans BR, Britten RJ, Davidson EH. Lineage and fate of each blastomere of the eight-cell sea urchin embryo. Genes & development. 1987;1:75–85. - PubMed
-
- Chuang CK, Wikramanayake AH, Mao CA, Li X, Klein WH. Transient appearance of Strongylocentrotus purpuratus Otx in micromere nuclei: cytoplasmic retention of SpOtx possibly mediated through an alpha-actinin interaction. Developmental genetics. 1996;19:231–237. - PubMed
Publication types
MeSH terms
Substances
Grants and funding
LinkOut - more resources
Full Text Sources
Other Literature Sources
Research Materials
Miscellaneous
