. 2013 Sep;16(9):1315-23.
doi: 10.1038/nn.3488. Epub 2013 Aug 11.

Tuned thalamic excitation is amplified by visual cortical circuits

Affiliations

Tuned thalamic excitation is amplified by visual cortical circuits

Anthony D Lien et al. Nat Neurosci. 2013 Sep.

Erratum in

Abstract

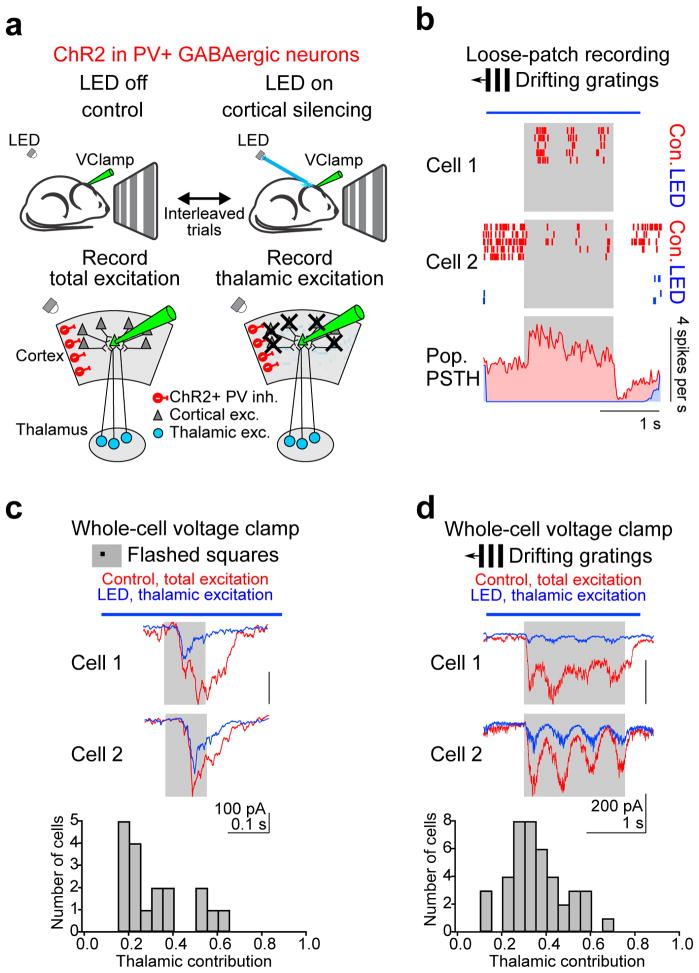
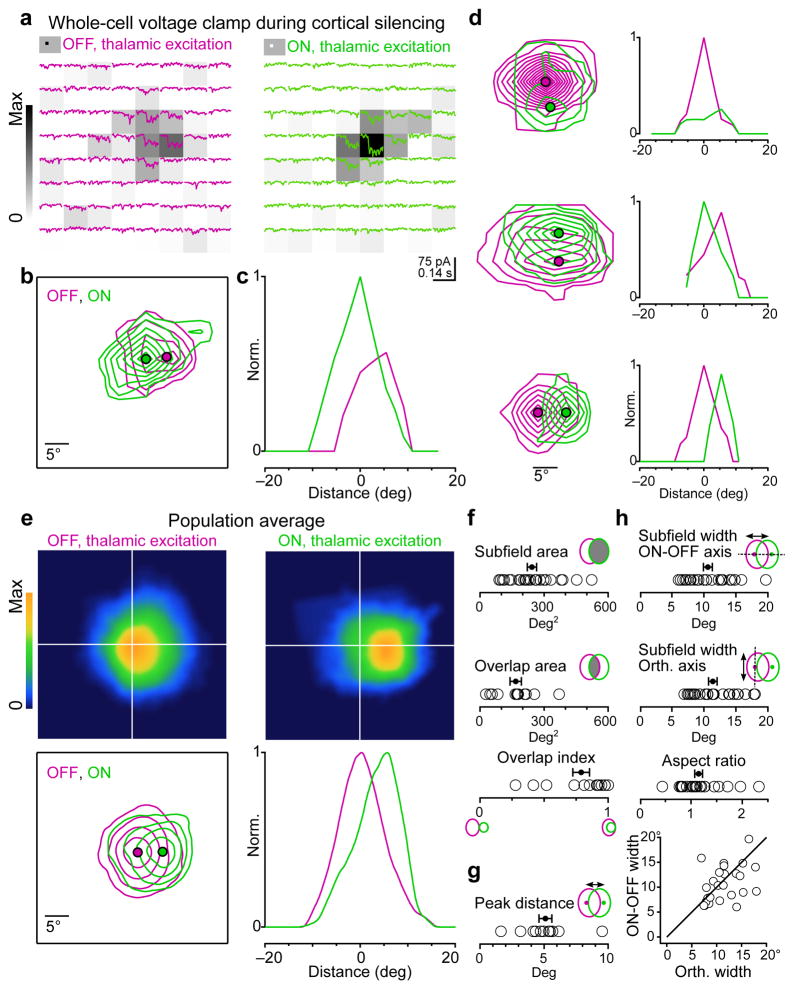
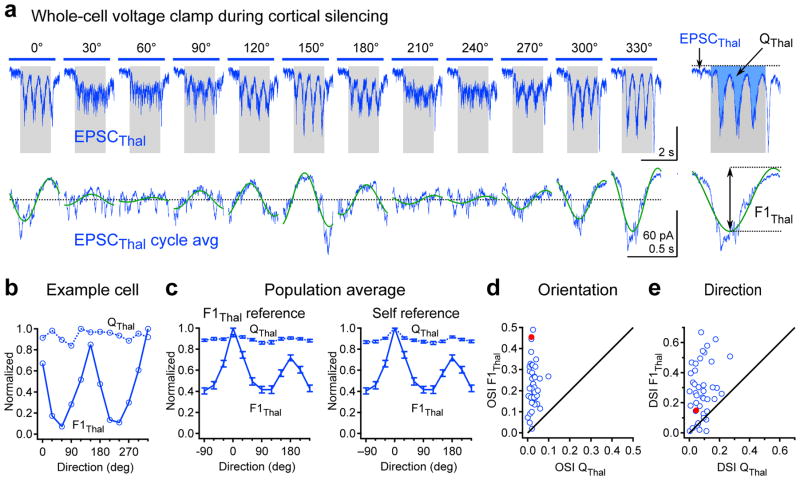
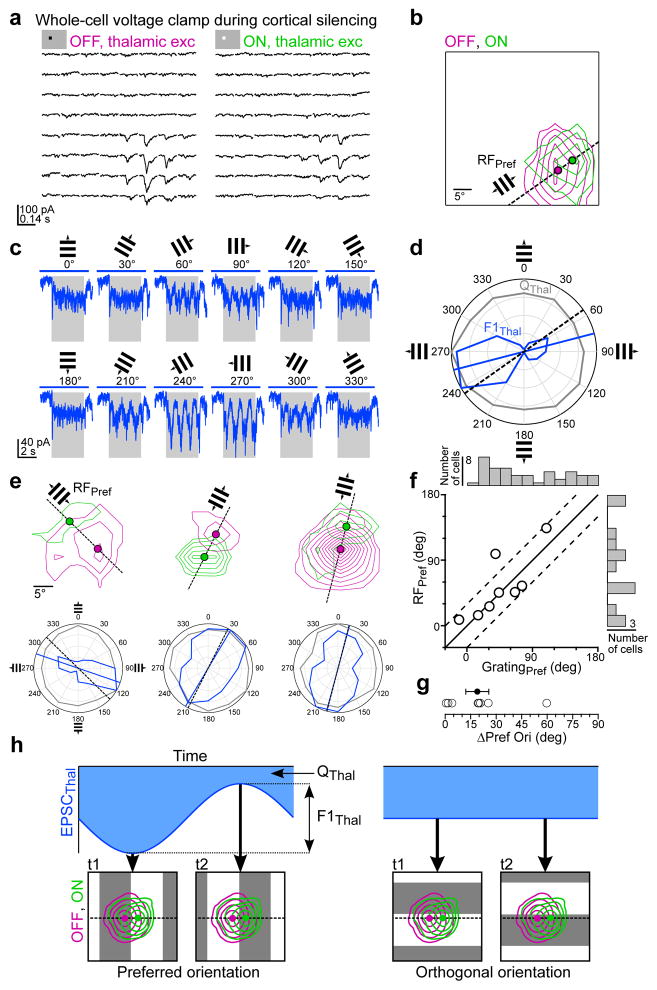
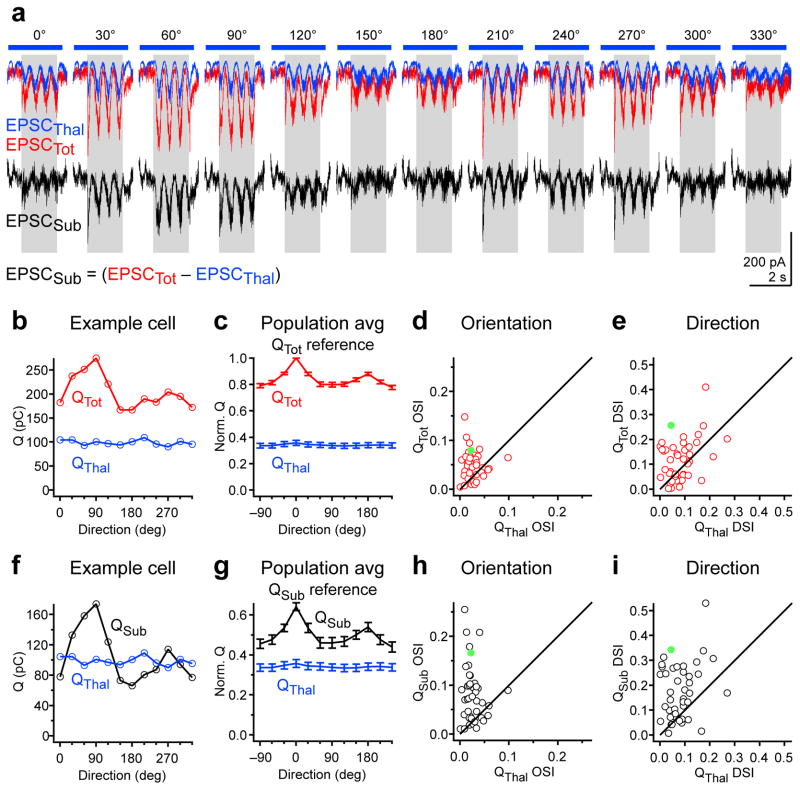
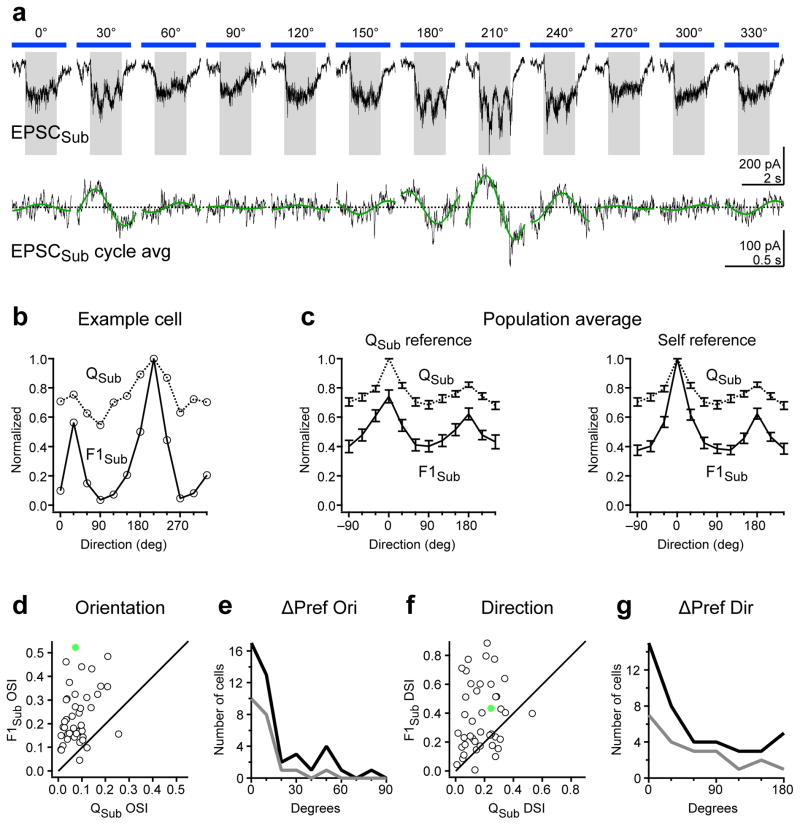
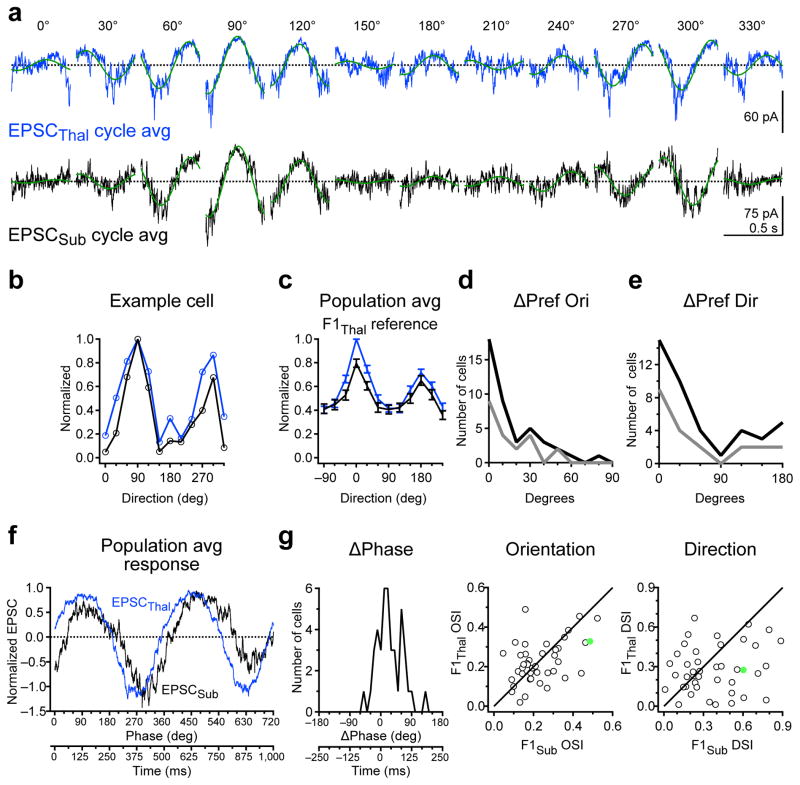
Cortical neurons in thalamic recipient layers receive excitation from the thalamus and the cortex. The relative contribution of these two sources of excitation to sensory tuning is poorly understood. We optogenetically silenced the visual cortex of mice to isolate thalamic excitation onto layer 4 neurons during visual stimulation. Thalamic excitation contributed to a third of the total excitation and was organized in spatially offset, yet overlapping, ON and OFF receptive fields. This receptive field structure predicted the orientation tuning of thalamic excitation. Finally, both thalamic and total excitation were similarly tuned to orientation and direction and had the same temporal phase relationship to the visual stimulus. Our results indicate that tuning of thalamic excitation is unlikely to be imparted by direction- or orientation-selective thalamic neurons and that a principal role of cortical circuits is to amplify tuned thalamic excitation.


Conflict of interest statement

Competing Financial Interests

The authors declare no competing financial interests.

Figures

Figure 1
Figure 1. Isolating thalamic excitation
a, Schematic of experimental approach for isolating thalamic excitation recorded in response to visual stimulation in layer 4 neurons voltage clamped at the reversal potential for inhibition. Thalamic excitation is isolated by silencing cortical activity via photostimulation of ChR2-expressing PV cells. b, Optogenetic silencing of visually evoked cortical activity. Top: The spiking responses of two example cortical neurons recorded in the loose patch configuration with (LED, blue) and without (control, red) PV cell photostimulation are shown as raster plots. Gray rectangle, visual stimulus (1.5 s). Blue bar, LED illumination (2.6 s). Control and LED trials were interleaved, but separated here for clarity. Bottom, population peristimulus time histogram (PSTH) averaged across all cells and all stimulus directions (n = 14 cells, 2 mice). Note complete suppression of spiking during LED illumination. The high spontaneous activity and its stimulus-evoked reduction in cell 2 were rare. c, Total and thalamic excitation in response to flashed squares. Top, visually evoked EPSCs recorded in two example cortical neurons with (blue) and without (red) cortical silencing in response to a flashed square (5 degrees) at optimal location and luminance. Average of 8 (cell 1) and 4 (cell 2) trials. Gray rectangle, visual stimulus. Blue bar, LED illumination. Bottom, distribution of the fraction of excitatory charge contributed by the thalamus (n = 18 cells, 16 mice). d, Same as c for drifting gratings. The response to the preferred direction is shown. Average of 8 (cell 1) and 5 (cell 2) trials. Bottom, distribution of the fraction of excitatory charge contributed by the thalamus (n = 42 cells, 33 mice).
Figure 2
Figure 2. Receptive field structure of thalamic excitation
a, Example cell. Isolated thalamic excitation (EPSCThal) in response to black (“OFF”, magenta traces, left) or white (“ON”, green traces, right) squares at each of 64 locations on an 8×8 grid. Stimuli appear at the beginning of each trace and last for 100 ms. The raw receptive field heat maps calculated from the thalamic excitatory charge (QThal) evoked at each grid location and normalized to the peak ON response are depicted by the background gray-level of each trace. Average of 4 trials per location. b, Contour plot of the OFF and ON subfields for the cell in a. Each contour represents 2 z-scores. Filled magenta and green circles mark the peaks of the OFF and ON receptive fields, respectively. c, Profile plot of OFF and ON receptive fields in c along the axis connecting their peaks. d, Same as b and c for 3 additional neurons. e, Population average of OFF and ON receptive fields. Before averaging, the receptive fields for each cell were centered on the peak of the OFF subfield and rotated so that the peak of the ON subfield was directly to the right of the OFF. OFF and ON subfields were separately normalized. Top, heat maps of the population average OFF and ON receptive fields. Bottom, contour and profile plots of the population average receptive fields as in b and c. The outermost contour represents 10% of the peak and each additional contour is an increment of 20% of the peak. f, Quantification of subfield area (n = 26 subfields) and overlap between ON and OFF subfields (n = 13 cells). g, Distance between the peaks of ON and OFF subfields (n = 13 cells). h, Comparison of subfield width along the axis connecting the ON and OFF peaks (ON/OFF axis) or the orthogonal axis (n = 26 subfields). Black line, unity. Data in e–h are from 13 cells each exhibiting 1 OFF and 1 ON subfield from 12 mice. Error bars, mean ± s.e.m.
Figure 3
Figure 3. Orientation tuning of thalamic excitation
a, Example cell: Top, Isolated thalamic excitation (EPSCThal) in response to drifting gratings of various orientations (average of 8 trials per direction). Gray rectangle, visual stimulus (1.7 s). Blue bar, LED illumination (2.6 s). Bottom, F1 modulation of EPSCThal. Cycle average (blue) and best-fitting sinusoid (green) at the grating temporal frequency (2 Hz). The y-offset was removed to aid comparison of F1 amplitude across different orientations. Right, EPSCThal and cycle average in response to 330 degree grating at expanded time scale showing how QThal and F1Thal are determined. b, Orientation tuning curves of QThal (dashed line) and F1Thal (solid line) for the neuron in (a). c, Population tuning curves of QThal (dashed line) and F1Thal (solid line). Left, Population tuning curves in which QThal and F1Thal tuning curves for each cell were equally shifted so that the preferred direction of F1Thal occurred at 0 degrees (F1Thal reference). Right, Population tuning curves in which QThal and F1Thal tuning curves for each cell were independently shifted so that preferred direction of QThal and F1Thal both occurred at 0 degrees (self reference). d, Orientation selectivity index (OSI) of QThal plotted against OSI of F1Thal for each cell. e, Direction selectivity index (DSI) of QThal plotted against DSI of F1Thal for each cell. Filled red markers in d and e denote the OSI and DSI values of the example cell. Data in c–e are from n = 42 cells from 33 mice. Error bars, mean ± s.e.m.
Figure 4
Figure 4. Separation of ON and OFF thalamic subfields predicts preferred orientation of thalamic excitation
a–d, Example recording of isolated thalamic excitation (EPSCThal) where both the ON and OFF receptive fields and the responses to drifting gratings at various orientations were obtained in the same cell. a, EPSCThal in response to black and white squares. Average of 5 trials per location. b, Contour plot of the OFF and ON receptive field maps for the cell in a. Each contour represents 2 z-scores. Filled magenta and green circles mark the peaks of the OFF and ON receptive fields, respectively. Dashed black line connects the OFF and ON peaks to define the ON-OFF axis. The preferred orientation predicted from the ON-OFF axis, RFPref, is indicated by the small grating. c, EPSCThal in response to drifting gratings of various orientations (average of 3 trials per direction). Gray rectangle, visual stimulus (1.7 s). Blue bar, LED illumination (2.6 s). d, Orientation tuning curves of F1Thal (blue) and QThal (gray) in polar coordinates for the responses in c. The blue line indicates the preferred orientation of F1Thal (GratingPref) and the black dashed line corresponds to RFPref. e, Same as b and d for three additional cells. f, RFPref plotted against GratingPref (n = 8 cells, 7 mice). Black line, unity. The dashed lines denote the region in which cells the difference between RFPref and GratingPref is less than 30 degrees. The distributions of GratingPref (n = 42, 33 mice) and RFPref (n = 13 cells, 12 mice) across the population of cells in which either value was measured are shown along the top and right, respectively. g, Absolute difference in RFPref and GratingPref (ΔPref Ori) (n = 8 cells, 7 mice). Error bars, mean ± s.e.m. h, Diagram of how orientation tuning of F1Thal arises from spatially offset OFF and ON thalamic excitatory input. The area of the blue shaded region corresponds to QThal. The difference between the peak and the trough of EPSCThal corresponds to F1Thal.
Figure 5
Figure 5. Tuning of non-thalamic excitatory charge
a, Example cell: Top, EPSCThal (blue) and EPSCTot (red) in response to drifting gratings of various orientations. Bottom, EPSCSub derived from point-by-point subtraction of EPSCThal from EPSCTot. Gray rectangle, visual stimulus (1.7 s). Blue bar, LED illumination (2.6 s). b, Orientation tuning curves of QTot (red) and QThal (blue) for the example cell in (a). c, Population tuning curves of QTot (red) and QThal (blue). Tuning curves are aligned to the preferred direction of QTot (Qtot reference) and normalized by the value of QTot at its preferred direction. d, OSI of QTot plotted against OSI of QThal for all neurons. e, DSI of QTot plotted against DSI of QThal for all neurons. f–i, Same as (b–e) for QSub (black) and QThal (blue). Filled green markers in d, e, h, and i denote the OSI and DSI values of the example cell. Data in c–e and g–i are from n = 42 cells from 33 mice. Error bars, mean ± s.e.m.
Figure 6
Figure 6. Tuning of non-thalamic excitatory F1 modulation
a, Example cell: Top, EPSCSub in response to drifting gratings of various orientations. Gray rectangle, visual stimulus (1.5 s). Blue bar, LED illumination (2.6 s). Bottom, F1 modulation of EPSCSub. Cycle average (black) and best-fitting sinusoid (green) at the grating temporal frequency (2 Hz). b, Orientation tuning curves of QSub (dashed curve) and F1Sub (solid curve) for the example cell in a. c, Population tuning curve of QSub (dashed curve) and F1Sub (solid curve). Left, Population tuning curves in which QSub and F1Sub tuning curves for each cell were equally shifted so that the preferred direction of Qsub occurred at 0 degrees (Qsub reference). Right, Population tuning curves in which QSub and F1Sub tuning curves for each cell were independently shifted so that preferred direction of QSub and F1Sub both occurred at 0 degrees (self reference). d, OSI of F1Sub is plotted against OSI of QSub for all neurons. e, Distribution of absolute differences in preferred orientation (ΔPref Ori) between QSub and F1Sub. Dark curve, all cells (n = 42). Gray curve, cells in the top 50th percentile of F1Sub OSI (n = 21). f–g, Same as (d–e) for DSI and absolute differences in preferred direction (ΔPref Dir). Filled green markers in d and f denote the OSI and DSI values of the example cell. Data in c–g are from n = 42 cells from 33 mice. Error bars, mean ± s.e.m.
Figure 7
Figure 7. Co-tuning and phase relationship between thalamic and non-thalamic excitation
a, Cycle average of EPSCThal (blue) and EPSCSub (black) for an example cell. Green curves are the best-fitting sinusoids at the grating temporal frequency (2 Hz). b, Orientation tuning curves of F1Thal (blue) and F1Sub (black) for cell in a. c, Population tuning curves of F1Thal (blue) and F1Sub (black). F1Thal and F1Sub tuning curves were aligned to the preferred direction of F1Thal (F1thal reference) d, Top, distribution of absolute difference in preferred orientation (ΔPref Ori) between F1Thal and F1Sub. Dark curve, all cells (n = 42). Gray curve, cells in the top 50th percentile of F1Thal OSI (n = 21). Bottom, OSI of F1Thal is plotted against OSI of F1Sub for all neurons. e, Same as d for absolute differences in preferred direction (ΔPref Dir) and DSI. f, Population average of EPSCThal (blue) and EPSCSub (black) over two grating cycles at the preferred direction of F1Thal and aligned to the F1 phase of EPSCThal. g, Distribution of F1 phase difference (ΔPhase) between EPSCThal and EPSCSub for responses from f. F1 phase of EPSCThal is set to 0 degrees. Data in c–g are from n = 42 cells from 33 mice. Error bars, mean ± s.e.m.

Comment in

  • A finely tuned cortical amplifier.
    Han Y, Mrsic-Flogel T. Han Y, et al. Nat Neurosci. 2013 Sep;16(9):1166-8. doi: 10.1038/nn.3507. Nat Neurosci. 2013. PMID: 23982448 No abstract available.

References

    1. Nelson S, Toth L, Sheth B, Sur M. Orientation selectivity of cortical neurons during intracellular blockade of inhibition. Science. 1994;265:774–7. - PubMed
    1. Anderson JS, Carandini M, Ferster D. Orientation tuning of input conductance, excitation, and inhibition in cat primary visual cortex. Journal of neurophysiology. 2000;84:909–26. - PubMed
    1. Liu BH, et al. Intervening inhibition underlies simple-cell receptive field structure in visual cortex. Nature neuroscience. 2010;13:89–96. - PMC - PubMed
    1. Liu BH, et al. Broad inhibition sharpens orientation selectivity by expanding input dynamic range in mouse simple cells. Neuron. 2011;71:542–54. - PMC - PubMed
    1. Brecht M, Sakmann B. Dynamic representation of whisker deflection by synaptic potentials in spiny stellate and pyramidal cells in the barrels and septa of layer 4 rat somatosensory cortex. The Journal of physiology. 2002;543:49–70. - PMC - PubMed

Publication types

MeSH terms