. 2013 Sep;16(9):1324-30.
doi: 10.1038/nn.3494. Epub 2013 Aug 11.

Linear transformation of thalamocortical input by intracortical excitation

Affiliations

Linear transformation of thalamocortical input by intracortical excitation

Ya-tang Li et al. Nat Neurosci. 2013 Sep.

Abstract

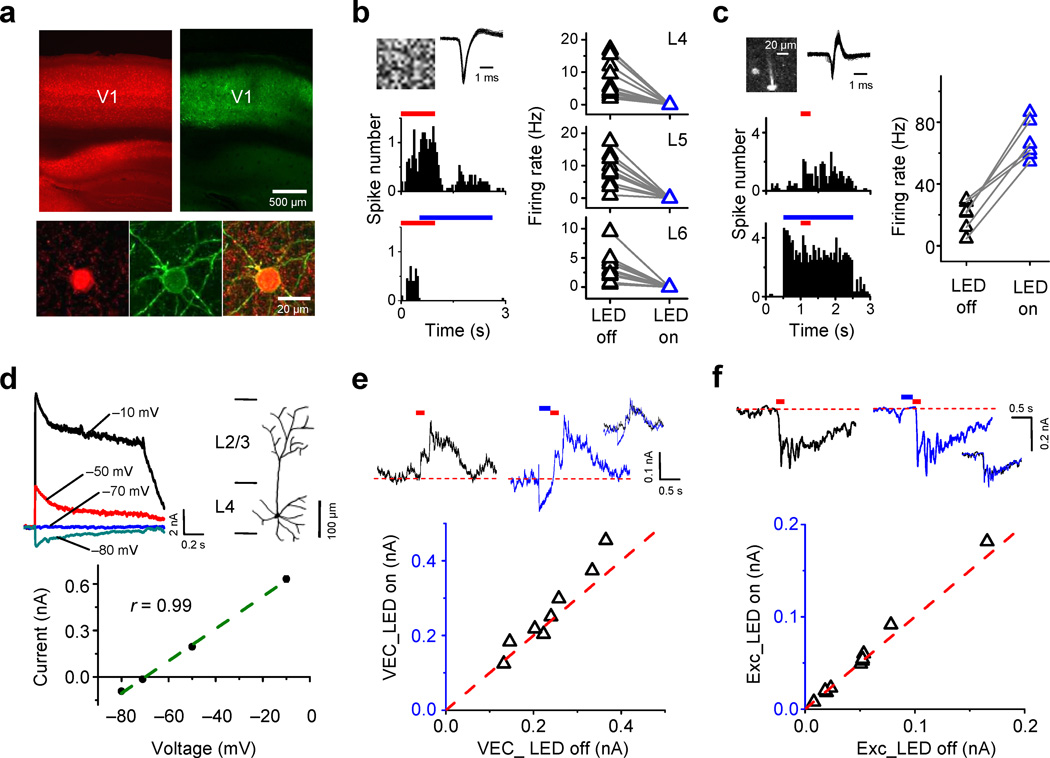
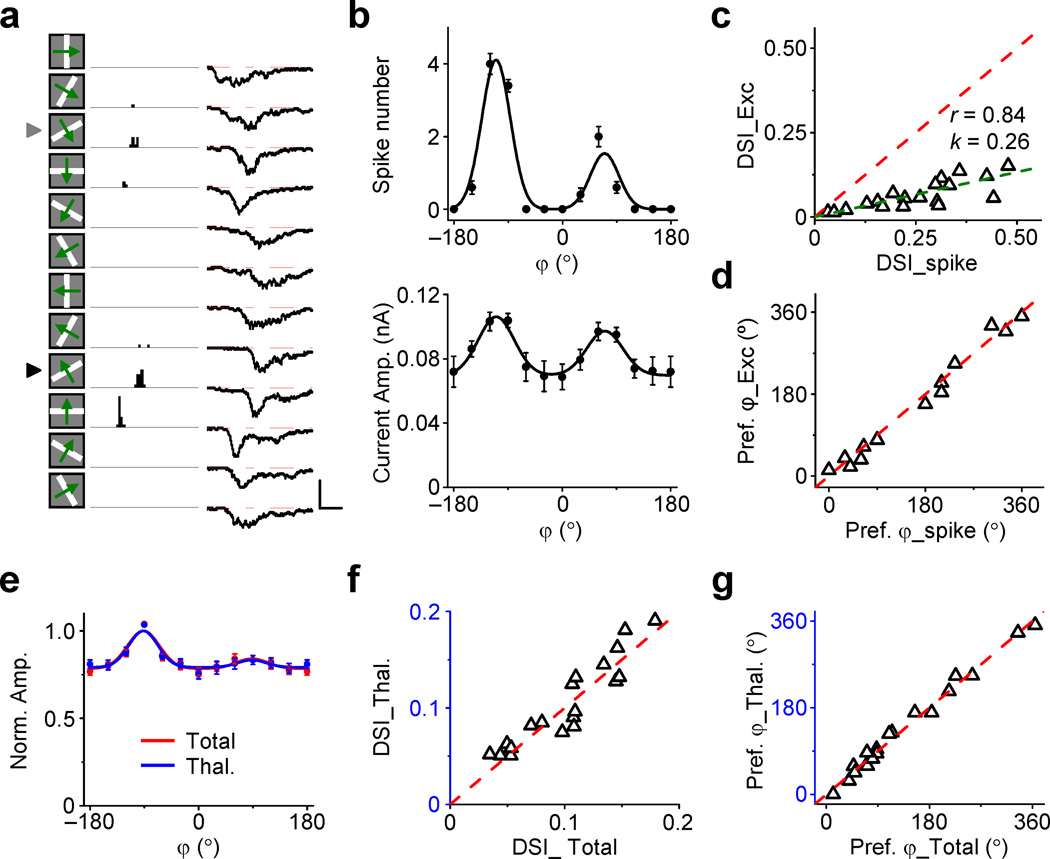
Neurons in thalamorecipient layers of sensory cortices integrate thalamocortical and intracortical inputs. Although we know that their functional properties can arise from the convergence of thalamic inputs, intracortical circuits could also be involved in thalamocortical transformations of sensory information. We silenced intracortical excitatory circuits with optogenetic activation of parvalbumin-positive inhibitory neurons in mouse primary visual cortex and compared visually evoked thalamocortical input with total excitation in the same layer 4 pyramidal neurons. We found that intracortical excitatory circuits preserved the orientation and direction tuning of thalamocortical excitation, with a linear amplification of thalamocortical signals of about threefold. The spatial receptive field of thalamocortical input was slightly elongated and was expanded by intracortical excitation in an approximately proportional manner. Thus, intracortical excitatory circuits faithfully reinforce the representation of thalamocortical information and may influence the size of the receptive field by recruiting additional inputs.


Figures

Figure 1
Figure 1
Optogenetic silencing of visual cortical circuits. (a) Top, confocal images showing tdTomato (red) and ChR2-EYFP expression (green) patterns. Bottom, enlarged images. (b) Left, peri-stimulus spike time histograms (PSTHs) for responses of a layer 4 excitatory neuron to a flash noise stimulus (red bar) with and without LED illumination (blue bar). Top, visual stimulus pattern and superimposed 50 individual spikes. Right, average firing rates in LED off and LED on trials for cells in different layers (n = 14, 10, 11 from 6, 5, 5 mice for L4, L5, L6 respectively). (c) Left, PSTHs for responses of a tdTomato-labeled PV neuron. Top inset, two-photon image of the recorded cell and superimposed 100 individual spikes. Right, Average firing rates for 6 PV cells from 6 mice. (d) Top, LED illumination induced currents in a cell and its reconstructed morphology. Bottom, current amplitude (averaged within a 40 ms window) versus holding voltage (one-sided P = 0.005). (e) Top, visually-evoked ensemble currents (VEC) recorded in layer 4 without (left) and with (right) preceding LED illumination. Inset, superimposed traces. Bottom, peak amplitudes in LED on versus LED off trials (0.26 ± 0.11 vs. 0.24 ± 0.08 nA, P = 0.07, two-tailed paired t-test, n = 8 sites from 8 mice). (f) Top, visually-evoked excitatory currents without and with a preceding LED illumination. Bottom, peak amplitudes in LED on versus LED off trials (median: 0.051 vs. 0.051 nA, P = 0.23, two-sided Wilcoxon signed-rank test, n = 10 cells from 10 mice).
Figure 2
Figure 2
Linear amplification of orientation-tuned thalamocortical input. (a) Left, average excitatory responses (5 trails) of a cell to single drifting bars at 12 different directions. Arrowheads mark the preferred orientation. Light red and light blue dotted curves mark the response onsets. Scale: 0.1 (red)/ 0.04 (blue) nA, 0.5 s. Right top, orientation tuning curves of peak current amplitude for the total and thalamocortical excitation, as well as superimposed normalized tuning curves. Bar = s.d. Right bottom, peak current amplitudes at 6 orientations of LED on versus LED off trials. Dash line shows the linear fitting: “k” is the slope, “r” is the correlation coefficient, one-sided P = 0.0009. (b) Polar plots of excitatory current amplitude before (red) and after (blue) silencing the cortex for another three cells. The maximum axis value is labeled. (c) Average normalized orientation tuning curves of total excitatory input (red) and of thalamocortical input (blue). Bar = s.e.m. N = 19 cells from 19 mice. (d) OSI of thalamocortical input versus that of total excitation (0.059 ± 0.021 vs. 0.056 ± 0.023, P = 0.4, two-tailed paired t-test, n = 19 cells). Light gray labels individual cells that deviate significantly from the identity line (P < 0.05, bootstrap analysis). (e) Preferred orientation of thalamocortical input versus that of total excitation (P = 0.6, two-tailed paired t-test, n = 19 cells). (f) Distribution of scaling factors in the recorded cell population. Arrow points to the mean value.
Figure 3
Figure 3
Intracortical excitation preserves direction tuning. (a) PSTH for spike responses (left, 10 trials) to single drifting bars of an example layer 4 cell as well as its average excitatory responses (right, 10 trials) recorded under voltage clamp. Scale: 30 Hz / 0.1 nA, 0.5 s. (b) Top, tuning curve of average spike count (10 trials) for the same cell. Bottom, tuning curve of average peak excitatory current. Bar = s.d. (c) Direction selectivity index (DSI) of excitatory input versus that of spike response (n = 20 cells from 20 mice). Linear fitting (olive dash line): one-sided P = 1e–5. (d) Preferred direction of excitatory input versus that of spike response for cells with DSI > 0.2 (P = 0.3, two-tailed paired t-test, n = 13 cells from 13 mice). (e) Average normalized direction tuning curves for total excitation (red) and thalamocortical excitation (blue). Bar = s.e.m. N = 19 cells from 19 mice. (f) DSI for thalamocortical excitation versus that for total excitation (0.104 ± 0.045 vs. 0.102 ± 0.043, P = 0.49, two-tailed paired t-test, n = 19 cells from 19 mice). (g) Preferred direction of thalamocortical excitation versus that of total excitation (P = 0.86, two-tailed paired t-test, n = 19 cells).
Figure 4
Figure 4
Intracortical excitation expands visual receptive field. (a) Top left, stimulation of receptive field (green) boundary correlates with the response delay. Bottom, superimposed average bar-evoked excitatory currents without (red) and with (blue) LED illumination. Scale: 0.1 nA (red)/ 0.05 nA (blue), 0.5 s. Inside dodecagon: derived receptive fields before (red) and after (blue) cortical silencing. Scale: 10°. Top right, elliptical fitting of the receptive fields. (b) Top, average excitatory currents to a flash noise stimulus. Scale: 50 pA, 50 ms. Bottom, onset latencies in LED off versus LED on trials (64.1 ± 6.9 vs. 64.8 ± 6.3 ms, P = 0.32, two-tailed paired t-test, n = 19 cells from 19 mice; the same test applied below). Error bars represent s.d. (c) Receptive field size derived for thalamocortical and total excitation (mean ± s.d. marked). (d) Angle of receptive field major axis (P = 0.52). (e) Aspect ratio (1.63 ± 0.32 vs. 1.68 ± 0.29). Inset, distribution of aspect ratios of thalamocortical receptive fields. (f) Derived major receptive field axis versus measured preferred orientation (P = 0.54). (g) OSI versus aspect ratio. Linear fitting: one-sided P = 3.3e–4. (h) Excitatory currents of an example cell to single flash squares at different locations without and with LED stimulation. Scale: 0.1 nA (left) / 0.052 nA (right), 0.2 s. (i-k) Receptive fields measured by flash stimuli (n = 14 cells from 14 mice). P = 0.4 in (j). Aspect ratios in (k): 1.60 ± 0.21 vs. 1.58 ± 0.21, P = 0.46.
Figure 5
Figure 5
Orientation tuning of thalamic neurons. (a) Top, PSTHs for visually evoked spikes in a layer 6 neuron. Middle, PSTHs for responses to drifting bars without (black) and with (blue) LED illumination of a dLGN neuron in the same animal. Bottom, polar plots of average spike count. (b) OSI of dLGN neuron responses (LED on, 0.093 ± 0.052; LED off, 0.089 ± 0.054, P = 0.48, two-tailed paired t-test, n = 18 cells from 12 mice). (c) Average normalized tuning curves for dLGN neurons. Bar = s.e.m. (d) Evoked spike numbers for dLGN neurons (LED on, 10.4 ± 4.9; LED off, 10.9 ± 5.3; P = 0.27, two-tailed paired t-test, n = 18 cells from 12 mice). (e) Distribution of OSIs for dLGN neuron spikes, thalamocortical excitation, and layer 4 neuron spikes to drifting bars (n = 18, 19, 33 cells from 12, 19, 25 mice respectively). ***, P = 5.4e–10 and 1.4e–11 (top); *, P = 0.022, one-way ANOVA post-hoc test (Tamhane’s T2 test). Error bars represent s.d. (f) Spike responses of an example TRN neuron to drifting gratings (three cycles). Data are displayed similarly as in (a). (g) Average evoked firing rates of TRN neurons (LED on, 2.8 ± 2.3; LED off, 10.2 ± 4.6 Hz, P = 3.6e–9, one-tailed paired t-test, n = 20 cells from 16 mice). (h) OSI of TRN neuron responses (LED on, 0.040 ± 0.027; LED off, 0.044 ± 0.025, P = 0.59, two-tailed paired t-test, n = 20 cells from 16 mice).

Comment in

  • A finely tuned cortical amplifier.
    Han Y, Mrsic-Flogel T. Han Y, et al. Nat Neurosci. 2013 Sep;16(9):1166-8. doi: 10.1038/nn.3507. Nat Neurosci. 2013. PMID: 23982448 No abstract available.

References

    1. Douglas RJ, Martin KA. A functional microcircuit for cat visual cortex. J Physiol. 1991;440:735–769. - PMC - PubMed
    1. Callaway EM. Local circuits in primary visual cortex of the macaque monkey. Annu Rev Neurosci. 1998;21:47–74. - PubMed
    1. Hubel DH, Wiesel TN. Receptive fields, binocular interaction and functional architecture in the cat's visual cortex. J Physiol. 1962;160:106–154. - PMC - PubMed
    1. Reid RC, Alonso JM. Specificity of monosynaptic connections from thalamus to visual cortex. Nature. 1995;378:281–284. - PubMed
    1. Lampl I, Anderson JS, Gillespie DC, Ferster D. Prediction of orientation selectivity from receptive field architecture in simple cells of cat visual cortex. Neuron. 2001;30:263–274. - PubMed

Publication types

MeSH terms