

doi: 10.1038/nn.3493.
Epub 2013 Aug 11.
Intracortical multiplication of thalamocortical signals in mouse auditory cortex
Affiliations
- PMID: 23933752
- PMCID: PMC3844430
- DOI: 10.1038/nn.3493
Item in Clipboard
Intracortical multiplication of thalamocortical signals in mouse auditory cortex
Nat Neurosci.
2013 Sep.
Abstract
Cortical processing of sensory information begins with the transformation of thalamically relayed signals. We optogenetically silenced intracortical circuits to isolate thalamic inputs to layer 4 neurons and found that intracortical excitation linearly amplified thalamocortical responses underlying frequency and direction selectivity, with spectral range and tuning preserved, and prolonged the response duration. This signal pre-amplification and prolongation enhanced the salience of thalamocortically relayed information and ensured its robust, faithful and more persistent representation.
Figures
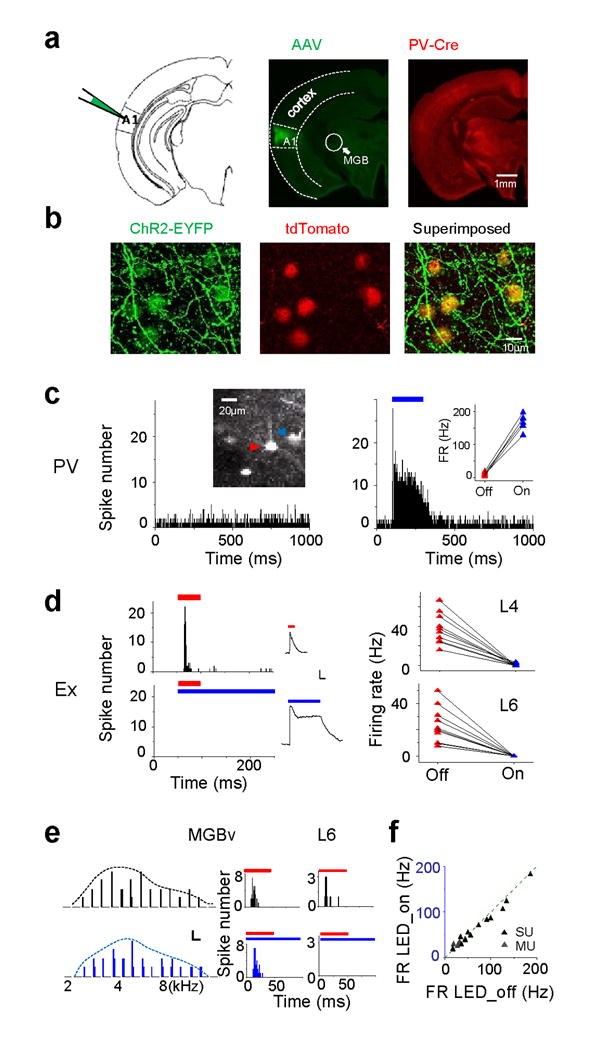
Optogenetic silencing of intracortical circuits in auditory cortex. (a) Schematic drawing and confocal images of a brain section, showing ChR2-EYFP and tdTomato expression in the A1. (b) ChR2-EYFP was expressed in tdTomato-labeled PV neurons. (c) Peri-stimulus spike time histogram (PSTH) for an example PV cell without (left) and with (right) LED illumination (blue bar, 200 ms). Left inset, two-photon image of the cell-attached recording from the PV cell. Right inset, average firing rates in LED off (red) and LED on (blue) trials for 5 PV cells. (d) Left, PSTH of a layer 4 excitatory neuron to tone stimuli (red bar), and to combined tone and LED stimulation (blue bar). Middle, tone-evoked inhibitory current of an example cell (top) and LED-evoked inhibitory current in the same cell (bottom). Scale: 80 pA, 100 ms. Right, summary of tone-evoked firing rates without (red) and with (blue) LED illumination in layer 4 (L4) and layer 6 (L6) cells. Line connects data for the same cell. (e) Left, reconstructed frequency tuning of multi-unit spikes (shown by PSTH) for a MGBv site. Top, tone stimulation only. Bottom, tone combined with LED illumination. Scale: 1 (count), 100 ms. Middle, PSTHs of spike responses to tones (red bar) without (top) and with LED illumination (bottom). Right, PSTHs for a layer 6 excitatory neuron recorded in the same animal. (f) Summary of tone-evoked firing rates (FR) in single-cell loose-patch (SU) and multi-unit (MU) recordings without and with LED illumination (P = 0.08, paired t-test, n = 19).

Intracortical input linearly amplifies frequency-tuned thalamocortical input. (a) Average tone-evoked excitatory currents in an example cell at different frequencies without (black) and with (blue) LED illumination. The envelope curve outlines the frequency tuning of peak amplitude. Scale: 0.05 nA, 200 ms. (b) Left, peak amplitude of thalamic input versus total excitation evoked by the same tone stimulus. Linear fitting: r = 0.91, slope = 0.32, P < 1e-8, one-tail. Inset, the two envelope curves from a (normalized and superimposed). Right, onset latencies of thalamocortical (blue) and total (red) excitatory responses at different frequencies. (c, d) Another example cell. Scale: 0.035 nA, 200 ms. Linear fitting: r = 0.77, slope = 0.76, P = 3.4e-6, one-tail. (e) Total frequency range of thalamic input versus total excitation (2.74 ± 0.61 vs. 2.79 ± 0.61 octave, P = 0.38, Wilcoxon signed-rank test). Each data point represents one cell. (f) BW50% of thalamic input versus total excitation (1.79 ± 0.61 vs. 1.84 ± 0.57, P = 0.49, paired t-test). (g) Average peak amplitude of thalamic input versus total excitation (0.03 ± 0.03 vs. 0.07 ± 0.05 nA, P = 1.9e-4, paired t-test). (h) Response duration of thalamic input (measured at 10% of the maximal amplitude of BF-tone responses) versus total excitation (51.17 ± 22.06 vs. 92.99 ± 44.8 ms, P = 3.66e-4, Wilcoxon signed-rank test). Inset, average response traces without (black) and with (blue) LED illumination of an example cell. Scale: 0.04 nA, 50 ms.
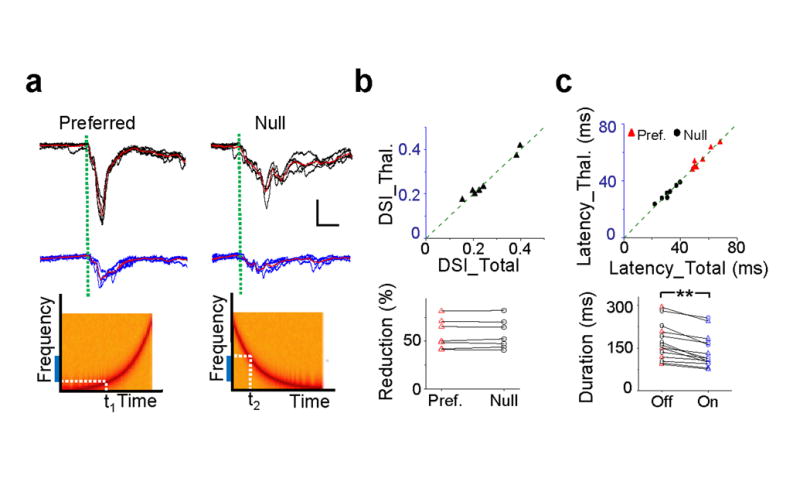
Intracortical input preserves direction tuning of thalamocortical input. (a) Top, superimposed excitatory currents and their average (red) evoked by upward and downward sweeps in an example cell without (upper) and with (lower) LED illumination. Green dotted line marks the response onset. Scale: 0.04 nA, 20 ms. Bottom, spectrograms of upward and downward FM sweeps. Blue bar labels the effective frequency range (frequency receptive field). t1 and t2 mark the timing when the FM sweeps hit its boundary. (b) Top, direction selectivity index (DSI) of thalamocortical input versus total excitation (0.26 ± 0.03 vs. 0.26 ± 0.03, P = 0.58, Wilcoxon signed-rank test, n = 7). Bottom, percentage reduction of peak response amplitude after cortical silencing for the preferred and null directional stimuli (0.57 ± 0.05 vs. 0.58 ± 0.05, P = 0.97, paired t-test). (c) Top, onset latency of thalamocortical input versus total excitatory input for the preferred and null directional stimuli. Preferred direction, 55.02 ± 2.56 vs. 55.28 ± 2.58 ms, P = 0.74, paired t-test; null direction, 31.38 ± 2.09 vs. 31.56 ± 1.87 ms, P = 0.75, paired t-test, n = 7. Bottom, response duration measured at the level of 10% of the maximal amplitude without (off) and with (on) LED illumination (170.39 ± 61.63 vs. 138.36 ± 55.14 ms, P = 1.22e-4, Wilcoxon signed-rank test, n = 14).
Comment in
-
A finely tuned cortical amplifier.Nat Neurosci. 2013 Sep;16(9):1166-8. doi: 10.1038/nn.3507. Nat Neurosci. 2013. PMID: 23982448 No abstract available.
-
Intrinsic cortical signal gain: optogenetic silencing reveals active role of cortical amplification during sensory input.Neurosurgery. 2014 Feb;74(2):N22-3. doi: 10.1227/01.neu.0000442981.91829.01. Neurosurgery. 2014. PMID: 24435150 No abstract available.
References
Publication types
MeSH terms
Substances
Grants and funding
LinkOut - more resources
Full Text Sources
Other Literature Sources
Research Materials
