. 2013 Sep;14(9):949-58.
doi: 10.1038/ni.2682. Epub 2013 Aug 11.

Inflammation-induced interstitial migration of effector CD4⁺ T cells is dependent on integrin αV

Affiliations

Inflammation-induced interstitial migration of effector CD4⁺ T cells is dependent on integrin αV

Michael G Overstreet et al. Nat Immunol. 2013 Sep.

Abstract

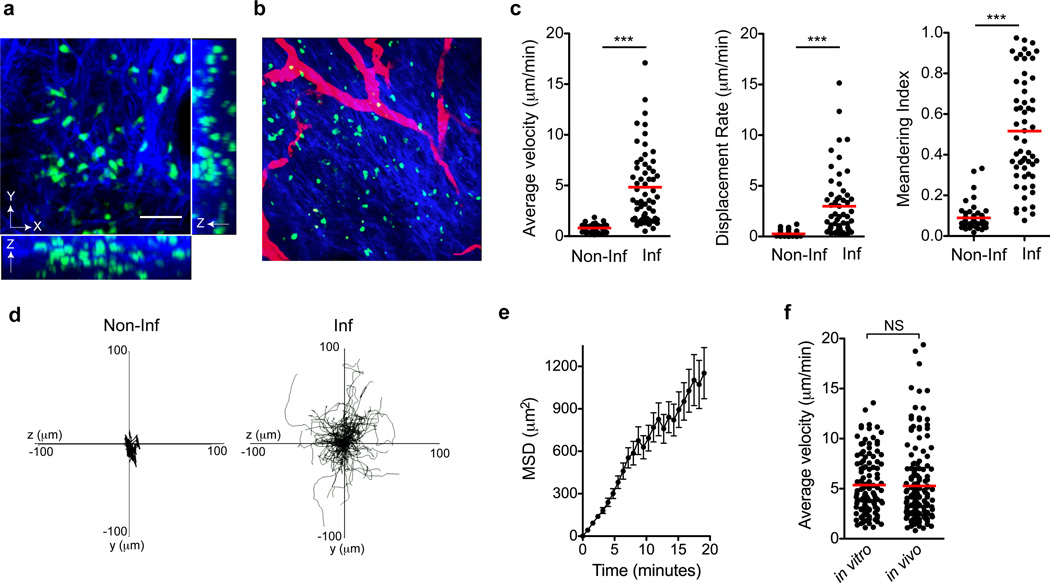
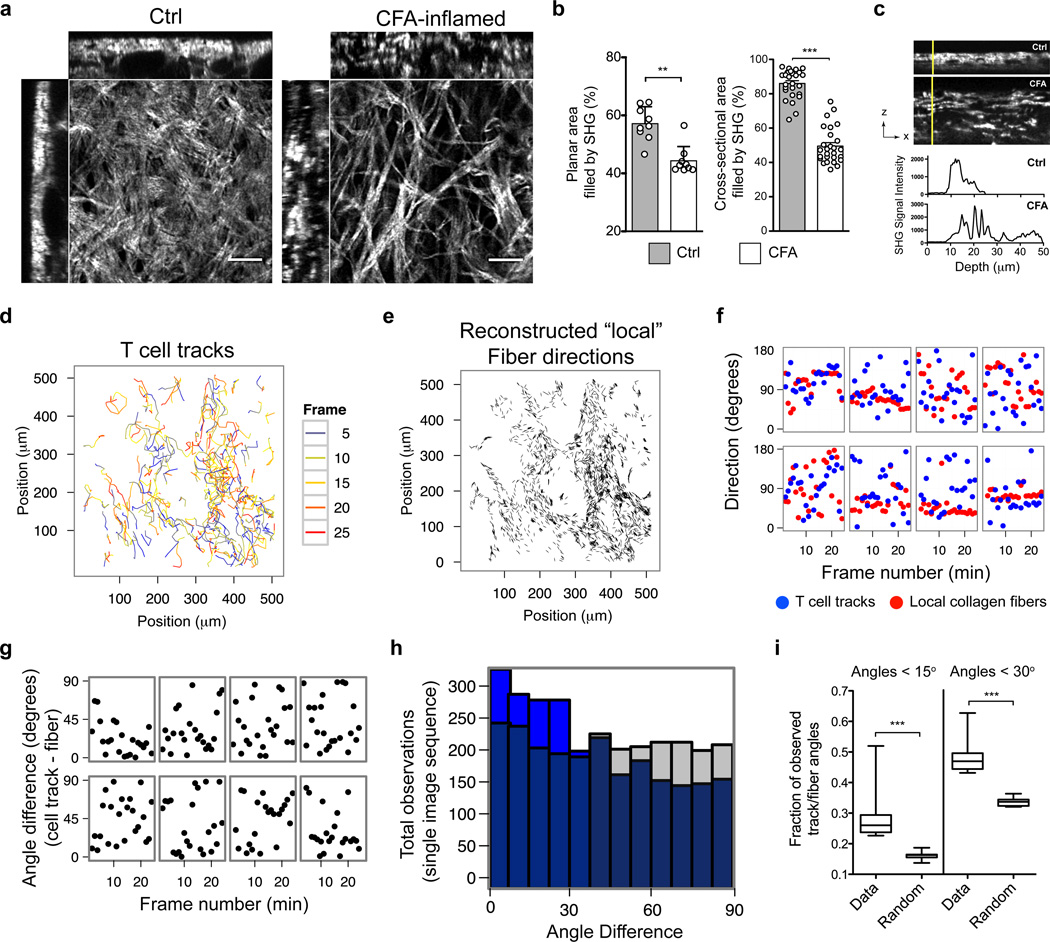
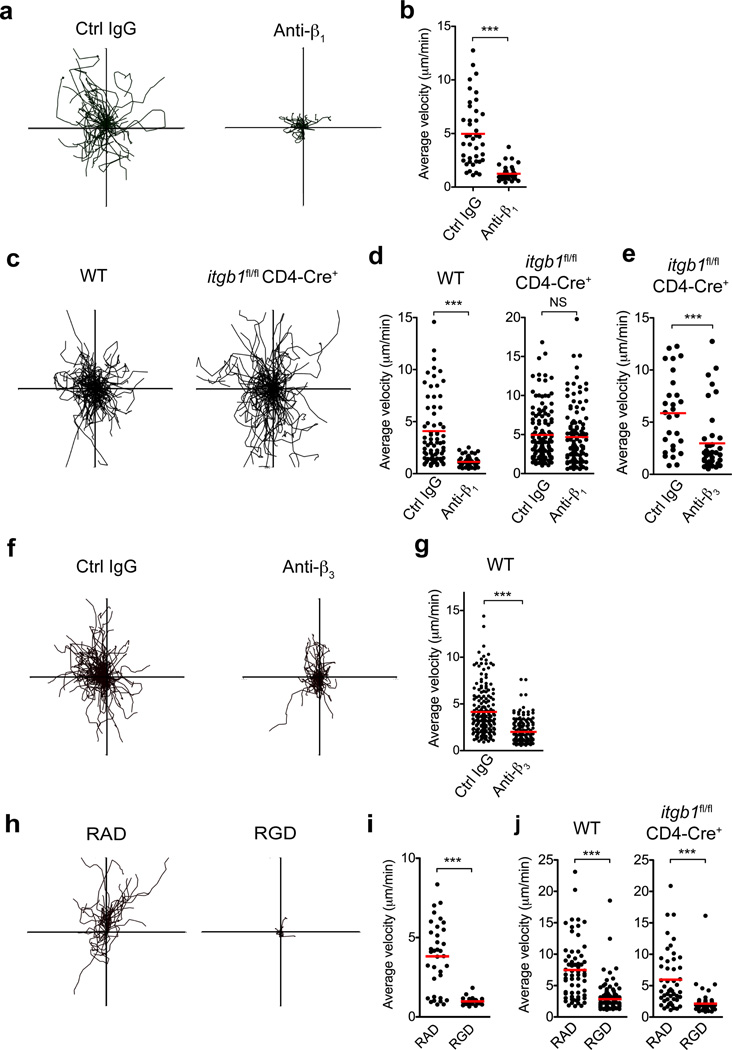
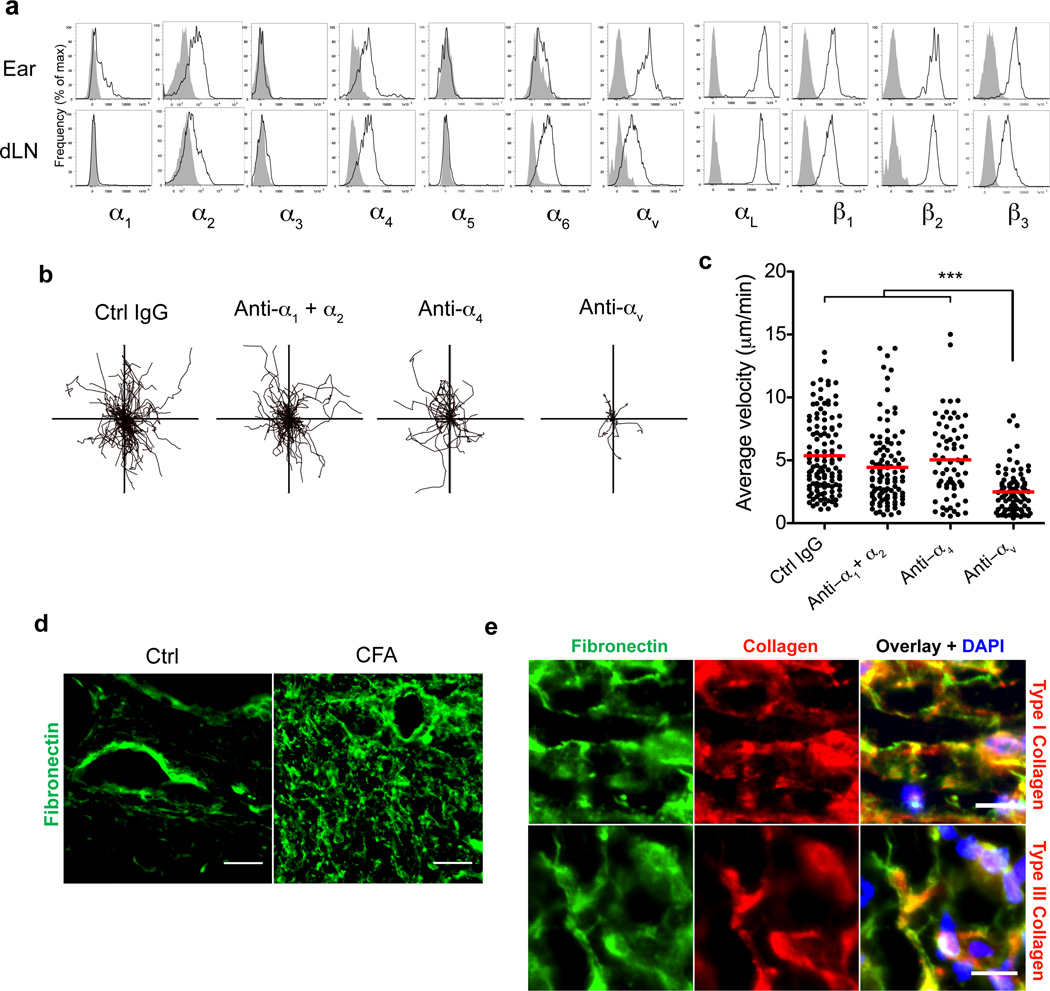
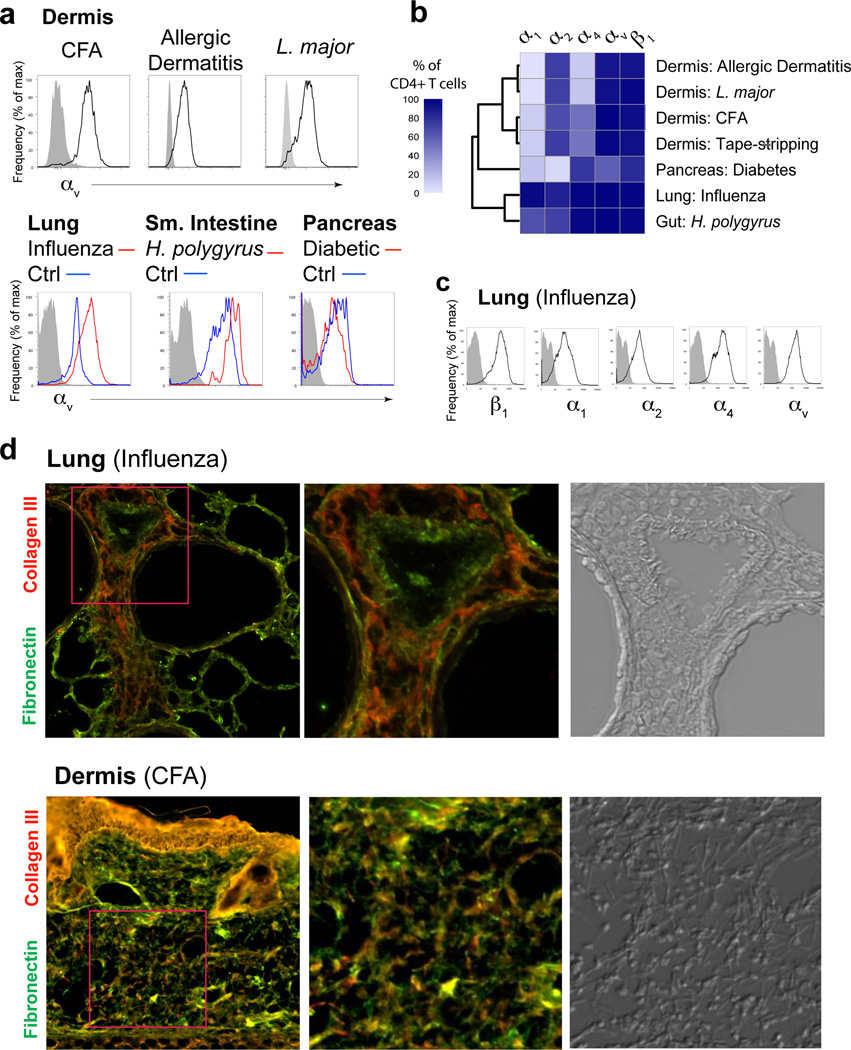
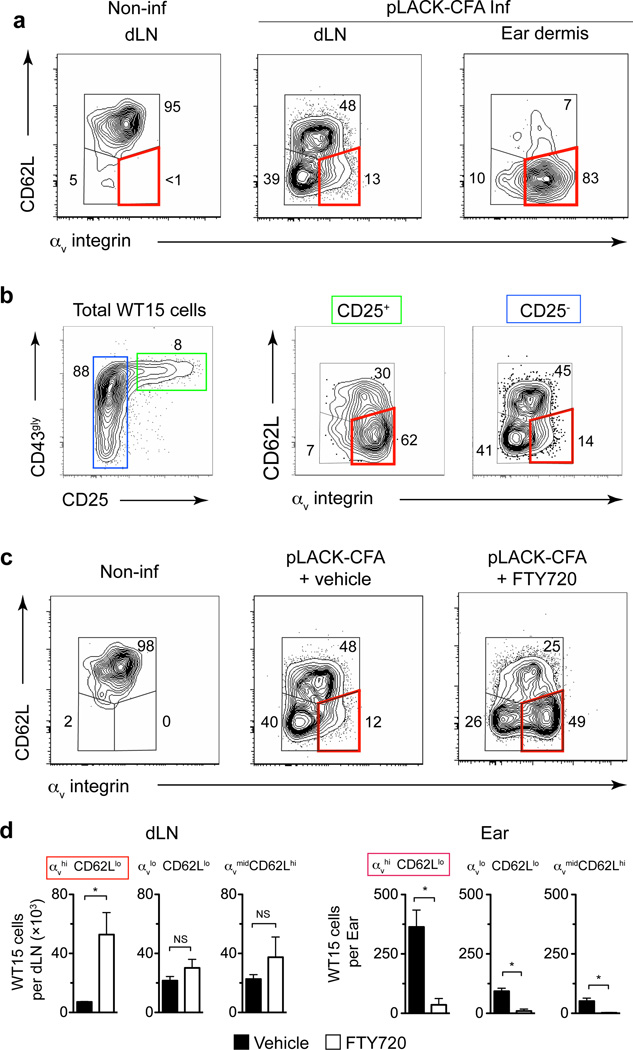
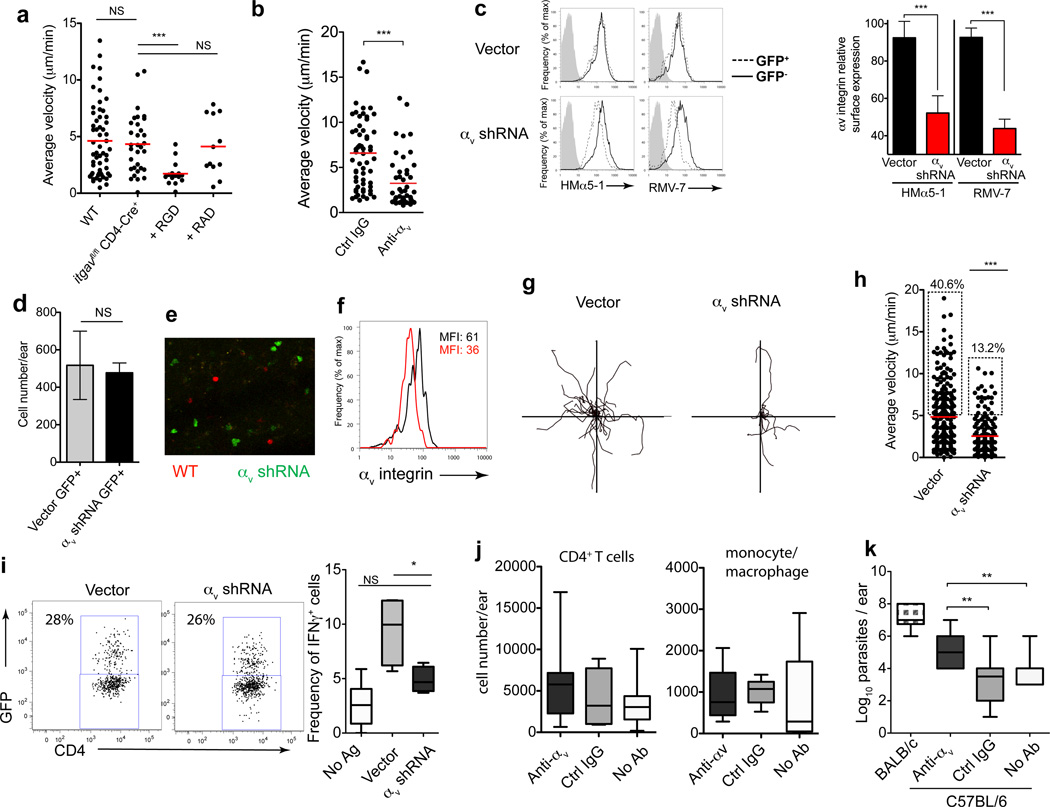
Leukocytes must traverse inflamed tissues to effectively control local infection. Although motility in dense tissues seems to be integrin independent and based on actomyosin-mediated protrusion and contraction, during inflammation, changes to the extracellular matrix (ECM) may necessitate distinct motility requirements. Indeed, we found that the interstitial motility of T cells was critically dependent on Arg-Gly-Asp (RGD)-binding integrins in the inflamed dermis. Inflammation-induced deposition of fibronectin was functionally linked to higher expression of integrin αV on effector CD4⁺ T cells. By intravital multiphoton imaging, we found that the motility of CD4⁺ T cells was dependent on αV expression. Selective blockade or knockdown of αV arrested T helper type 1 (TH1) cells in the inflamed tissue and attenuated local effector function. Our data demonstrate context-dependent specificity of lymphocyte movement in inflamed tissues that is essential for protective immunity.


Figures

Figure 1
Figure 1. Migratory patterns of effector TH1 T cells in the CFA-inflamed ear dermis
(a) Maximum intensity projections across X, Y, and Z axes of WT15 T cells (green) and collagen (second harmonic generation, blue) in the CFA-inflamed dermis. Scale bar, 40µm. (b) X-Y projection of T cells and SHG with vasculature shown in red using intravenous Texas Red-labeled dextran. (c) Steady-state (non-inflamed, Non-Inf) and CFA-inflamed (Inf) T cell motility by average velocity, displacement and meandering index. (d) X–Y projections of the T cell migration tracks over a 20-minute time span with CFA. (e) Mean squared displacement (MSD) of the T cell tracks show a linear increase over time. (f) Comparison of average velocities of T cells using adoptively transferred effector WT15 T cells (in vitro) or effector T cells primed in vivo using WT15 IFN-γ-YFP reporter cells to identify putative IFN-γ-producing cells (in vivo). Statistics by Mann-Whitney: ***p<0.001; NS, not significant, p>0.05. Data are representative of more than ten independent imaging experiments.
Figure 2
Figure 2. T cells migration is guided by ECM-fibers
BALB/c mice immunized with KLH/CFA in the ear dermis and analyzed by IV-MPM on day 3. Collagen structure by SHG. (a) Sample image volumes of non-immunized (Ctrl) and CFA-inflamed ears. (b) Analysis of planar area (XY) (left) and cross-sectional area (XZ) filled by SHG in control and CFA-inflamed ears. Left, each circle represents a unique region (150 µm × 150 µm area, avoiding hair follicles and blood vessels) from three different ears for each group. Right, each circle represents one of three orthogonal views analyzed for every one planar region analysis on the left. Bars represent mean ± SEM. (c) Cross-sectional images of SHG signal intensity in ear (top) and SHG across the vertical yellow lines (bottom). (d) Projection of cell tracks in x-y plane. Color code, frame at which T cell locations were observed. (e) Reconstructed fiber directions. (f) Migration and fiber directions along eight representative T-cell tracks. Directions are measured as angle relative to the x-axis of the image data: blue dots, T cell tracks; red dots, fibers. (g) Angle differences between fiber and migration directions in (f). (h) Histogram of angle differences for all tracks time steps from a single representative experiment (blue) compared to the distribution of angle differences that would result from random migration (grey). (i) Frequency of directional differences smaller than 15° and 30°, n=10 experiments. Statistical significances evaluated by Mann-Whitney: **p<0.01; ***p<0.001.
Figure 3
Figure 3. RGD-dependent integrin blockade impairs T cell motility in the inflamed dermis
(a, b) While imaging WT15 T cells in the inflamed ear dermis, control (Ctrl) IgG or a blocking antibody to β1 integrin were administered intravenously. (a) XY projections of T cell migratory paths over 25 minutes immediately following control IgG or anti-β1 integrin treatment (100 µg antibody). (b) Average velocity of T cells. (c) WT or β1-deficient (itgb1fl/fl × CD4-Cre+) OT-II T cells were imaged in the dermis and the resultant T cell crawling patterns are shown. (d) Blocking antibodies to β1 integrin were administered intravenously and OT-II T cell migration velocities shown for both WT and β1-deficient cells. (e) β1-deficient T cell migration velocities after blocking antibodies to β3 integrin. (f–g) While imaging WT OT-II T cells in the dermis, blocking antibodies to β3 integrin were administered intravenously and the resultant T cell crawling patterns (f) and migration velocities (g) are shown. (h–j) Immediately prior to imaging of adoptively transferred WT effector WT15 T cells, control RAD or integrin-blocking RGD peptides were injected into the CFA-inflamed ear dermis. (h) XY projections of T cell migratory paths over 25 minutes. (i) Average velocity of T cells over the same time period. (j) Immediately prior to imaging of WT and β1-deficient OT-II T cells in the inflamed dermis, control RAD or blocking RGD peptides were injected into the ear dermis and resultant T cell migration velocities are shown. Statistics by Mann-Whitney: ***p<0.001; NS, not significant, p>0.05.
Figure 4
Figure 4. CD4+ T cells utilize αv integrin for intradermal motility
(a) Integrin expression by in vivo-primed WT15 cells in the immunized ear dermis and draining lymph node five days after immunization. Histograms represent viable donor CD4+Thy-1.1+ (WT15) lymphocytes: integrin staining (black line) and isotype control staining (grey shaded). (b,c) While imaging effector WT15 T cells in the inflamed ear dermis, control (Ctrl) IgG or blocking antibodies (100 µg each) to the indicated integrin subunits were administered intravenously. XY projections of T cell migratory paths over 25 minutes immediately following treatment with indicated blocking antibody. c. Average velocities of T cells over the same time periods and treatments. (d) Immunohistological staining of fibronectin on frozen sections of control (non-inflamed, Ctrl) and KLH/CFA-immunized ears three days after immunization. Scale bar, 25µm. (e) Co-staining of fibronectin and types I or III collagen on KLH/CFA-inflamed ears. Scale bar, 10µm. Data are representative of at least three independent experiments for all antibody-blocking experiments. For (c) statistical significance was evaluated by a Kruskal-Wallis test with Dunn’s post-test; *** p<0.001.
Figure 5
Figure 5. Broad αv integrin expression by effector CD4+ T cells across tissues and types of inflammation
(a) Histogram profiles of αv integrin expression on total CD4+ T cells extracted from the ear dermis (top) and other tissues (bottom). Where indicated, αv expression on CD4+ T cells from non-inflamed (control) tissues are shown (blue line), compared to inflamed/infected tissue (red line) and isotype control staining (grey shaded). (b) Hierarchical clustering of the frequency of integrin-expressing T cell populations from different tissues. (c) Histogram expression profiles of indicated alpha chain integrin subunits on CD4+ T cells extracted from influenza-infected lung tissue (day 8 post-infection) compared to isotype control staining (grey shaded). (d) Comparison of fibronectin and collagen immunohistochemistry on tissues from influenza-infected lung (day 8) (top row) and CFA-inflamed dermis (bottom row). Second panels are larger representations of boxed areas from first panel. Third panel is a DIC image of same boxed area.
Figure 6
Figure 6. LN “emigrant” effector T cells express high levels of αv integrin
Naïve WT15 cells were transferred into BALB/c mice that were then immunized with pLACK/CFA (LACK-CFA Inf) in ear dermis the following day or not immunized (Non-inf). (a) αv integrin and CD62L expression on WT15 cells in the draining lymph node and ear dermis five days after immunization. Numbers represent cell frequency (%). The red box highlights the αvhi CD62Llo population throughout all panels in the figure. (b) Expression of αv on activated cells in the draining lymph node. Transferred cells gated on high or low expression of CD25 (left panel) and analyzed for αv and CD62L. (c, d) FTY720 (or vehicle) was administered days 3 and 4 post-immunization and αv and CD62L expression was evaluated on WT15 cells in the lymph node on day five. (d) Total numbers of WT15 cells in the draining lymph node and immunized ear dermis in mice treated with FTY720 (open bars) or vehicle (filled bars). Bars represent mean ± SEM. For (d) statistical significance was evaluated by a Mann-Whitney test: * p<0.05; NS, not significant, p>0.05. Data are representative of two independent experiments with similar results. n= 4–5 mice per group per experiment.
Figure 7
Figure 7. Non-redundant role for αv in effector CD4+ T cell intradermal motility and anti-microbial clearance
(a) αv-deficient (itgavfl/fl × CD4-Cre+) OT-II T cell average velocity in CFA-inflamed dermis and blockade with RGD peptides as in Fig 3. (b) β1-deficient OT-II T cell velocity in the CFA-inflamed ear after anti-αv antibody. (c) TH1-primed β1-deficient OT-II T cells transduced with MSCV-GFP encoding shRNA for αv integrin (αv shRNA) or empty vector (Vector). Left, surface expression of αv integrin day 4 after retroviral transduction on GFP+ and GFP- cells, with two αv antibody clones or isotype control(grey). Right, αv MFI of GFP+ and GFP- cells, normalized to the MFI of αv on untreated T cells. Bars represent mean ± SEM, four independent experiments. (d–i) Transduced T cells transferred to C57BL/6 mice and mice immunized intra-dermally with pOVA-CFA in one ear and KLH-CFA in the other ear (no cognate antigen, No Ag). Transduced T cells (GFP+) in the ear dermis imaged by IV-MPM day 3. (d) Number of vector or αv shRNA GFP+ T cells in the antigen-bearing dermis. (e) Dermal location of effector T cells following co-injection of SNARF-labeled WT (red) and GFP+ expressing αv shRNA (green) cells to pOVA-CFA immunized mice. (f) ex vivo αv expression on dermal GFP+ cells. Black line, control vector; red line, αv shRNA. (g) XY projections of T cell migration patterns and average velocities (h) (30 minutes). (i) Vector control and αv shRNA GFP+ expression in pOVA-CFA inflamed ears (left). Right, frequency of IFNγ producing vector or αv shRNA GFP+ TH1 cells, gated as in dot plots, by ex vivo intracellular cytokine staining for IFN-γ. No Ag, frequency of IFN-γ+-transferred cells in KLH-OVA inflamed ears (j) Mice were infected with L. major in the ear dermis. Four weeks post-infection, C57BL/6 mice were given anti-αv or control antibody i.p. (1mg/mouse) three times/week for 3 weeks. Mice were harvested at week 7 post-infection and CD4+ T cell numbers (j) and parasite load (k) determined in the infected ear dermis. Statistics by Mann-Whitney: *p<0.05; **p<0.01; ***p<0.001; NS, not significant, p>0.05. (k) ANOVA across C57BL/6 groups, p<0.0001 for parasite load.

Comment in

References

    1. Nourshargh S, Hordijk PL, Sixt M. Breaching multiple barriers: leukocyte motility through venular walls and the interstitium. Nat Rev Mol Cell Biol. 2010;11:366–378. - PubMed
    1. Friedl P, Weigelin B. Interstitial leukocyte migration and immune function. Nat Immunol. 2008;9:960–969. - PubMed
    1. Friedl P, Entschladen F, Conrad C, Niggemann B, Zanker KS. CD4+ T lymphocytes migrating in three-dimensional collagen lattices lack focal adhesions and utilize beta1 integrin-independent strategies for polarization, interaction with collagen fibers and locomotion. Eur J Immunol. 1998;28:2331–2343. - PubMed
    1. Jacobelli J, et al. Confinement-optimized three-dimensional T cell amoeboid motility is modulated via myosin IIA-regulated adhesions. Nat Immunol. 2010;11:953–961. - PMC - PubMed
    1. Woolf E, et al. Lymph node chemokines promote sustained T lymphocyte motility without triggering stable integrin adhesiveness in the absence of shear forces. Nat Immunol. 2007;8:1076–1085. - PubMed

Publication types

MeSH terms