. 2013 Oct;18(10):101318.
doi: 10.1117/1.JBO.18.10.101318.

Multispectral imaging in the extended near-infrared window based on endogenous chromophores

Affiliations

Multispectral imaging in the extended near-infrared window based on endogenous chromophores

Qian Cao et al. J Biomed Opt. 2013 Oct.

Abstract

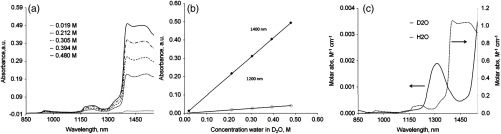
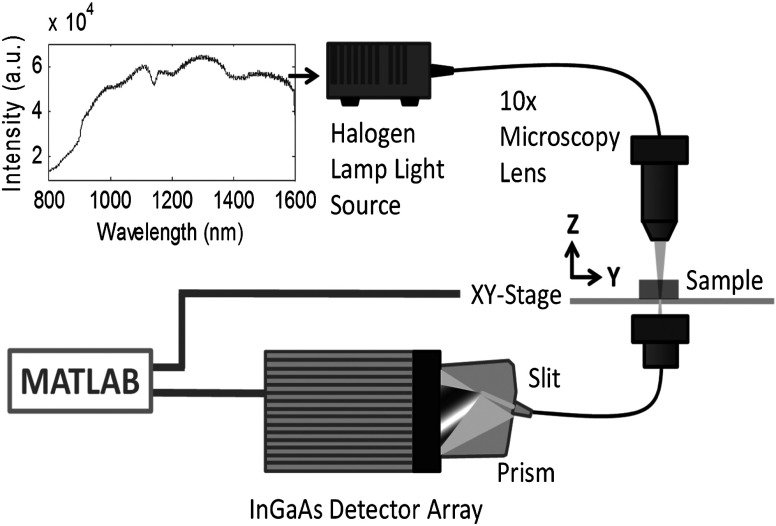
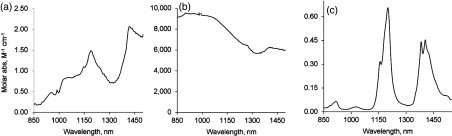
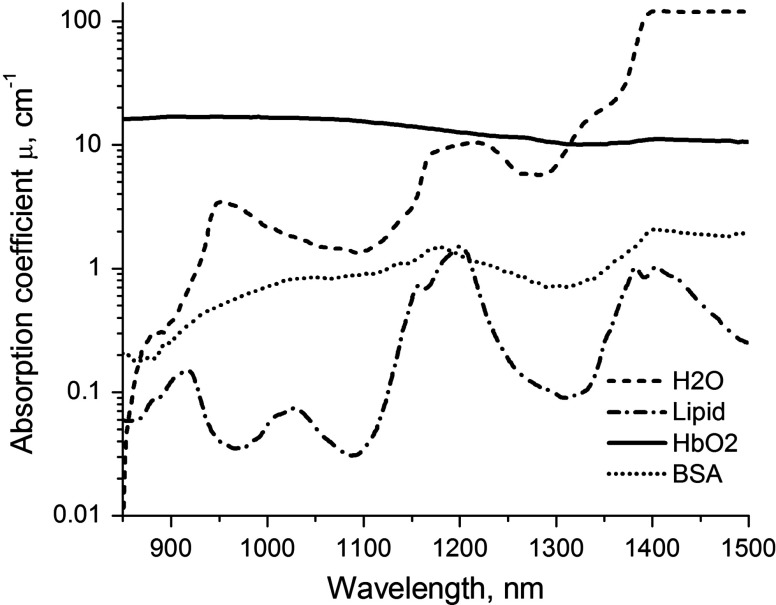
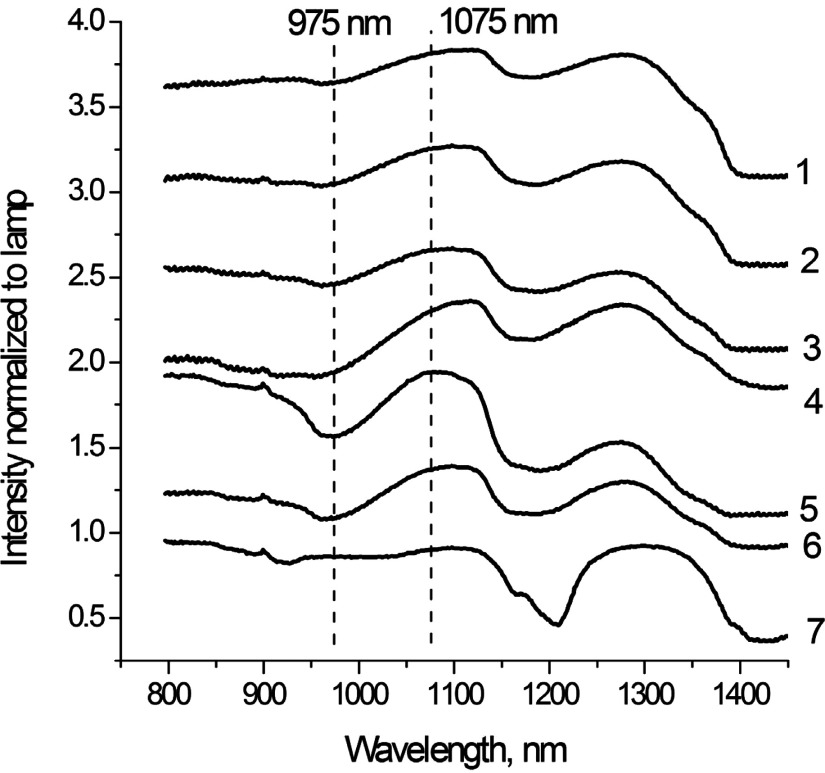
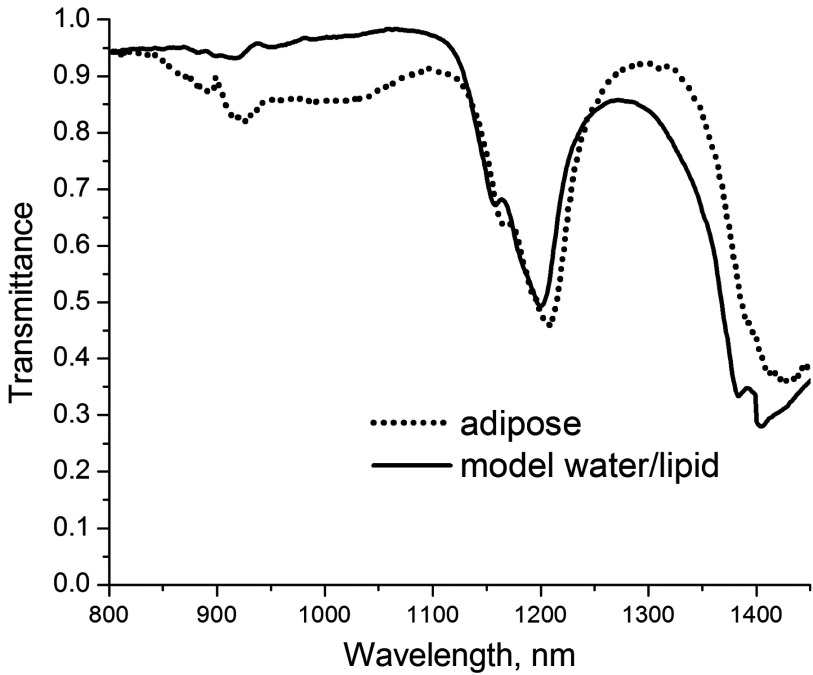
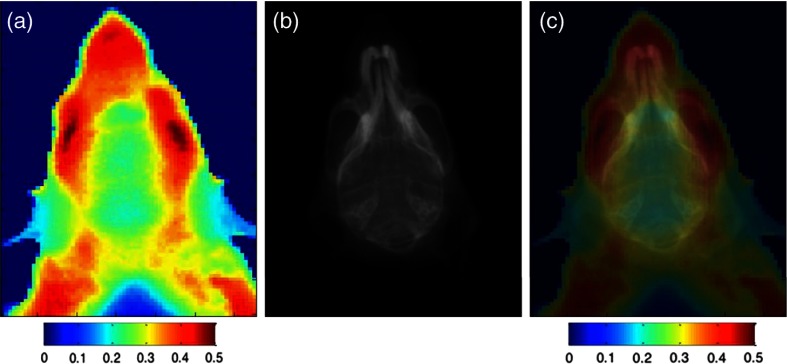
To minimize the problem with scattering in deep tissues while increasing the penetration depth, we explored the feasibility of imaging in the relatively unexplored extended near infrared (exNIR) spectral region at 900 to 1400 nm with endogenous chromophores. This region, also known as the second NIR window, is weakly dominated by absorption from water and lipids and is free from other endogenous chromophores with virtually no autofluorescence. To demonstrate the applicability of the exNIR for bioimaging, we analyzed the optical properties of individual components and biological tissues using an InGaAs spectrophotometer and a multispectral InGaAs scanning imager featuring transmission geometry. Based on the differences in spectral properties of tissues, we utilized ratiometric approaches to extract spectral characteristics from the acquired three-dimensional "datacube". The obtained images of an exNIR transmission through a mouse head revealed sufficient details consistent with anatomical structures.


Figures

Fig. 1
Fig. 1
Absorbance (a) and calibration plot (b) for normal water dissolved in deuterated water D2O. (b), empty circles: slope at 1200 nm, molar absortivity ε1200=0.087  M1cm1, R2=0.999; solid squares: ε1400=1400  nm, slope at 1400 nm, molar absorptivity ε1400=1.044  M1cm1, R2=1. (c) Molar absorptivity plot of H2O and D2O. References: for D2O spectrum—air; for H2O spectrum—D2O. The molar absorptivity spectra of D2O were recorded using one point of concentration 55.3 M (D2O) using air as a reference.
Fig. 2
Fig. 2
Experimental imaging setup in 800 to 1600 nm. The spectrum of the halogen lamp in exNIR obtained by this imager is shown in the upper left corner.
Fig. 3
Fig. 3
(a) Molar absorptivity spectrum of BSA after drying in D2O (cuvette 10 cm, quartz); Reference spectrum—D2O.(b) molar absorptivity spectrum of hemoglobin in D2O (cuvette 10 cm, quartz); Reference spectrum—D2O.(c) molar absorptivity spectrum of corn oil (cuvette 1 cm, quartz); Reference spectrum—air.
Fig. 4
Fig. 4
Absorption coefficients (μa) of individual components: water, solutions of hemoglobin, bovine serum albumin (both at 2.5% in D2O), and lipids.
Fig. 5
Fig. 5
Spectral characterization of various tissues using an exNIR imager. From top to bottom: 1. skeletal muscle, 2. liver, 3. kidney, 4. cardiac tissue, 5. cerebrum, 6. cerebellum, and 7. adipose. The individual graphs were offset for clarity.
Fig. 6
Fig. 6
Modeling adipose tissue by linearly combining spectra of water (19%), and lipid (81%) results in the spectrum similar to the spectrum of adipose acquired from an exNIR image.
Fig. 7
Fig. 7
Imaging of a mouse head (a) exNIR image at the ratio 1075/975 nm, (b) an X-ray image of the same region of the mouse, and (c) coregistration exNIR/X-ray imaging.

References

    1. Sakudo A., et al. , “Visible and near-infrared spectral changes in the thumb of patients with chronic fatigue syndrome,” Clin. Chim. Acta 403(1–2), 163–166 (2009). 10.1016/j.cca.2009.02.010 - DOI - PubMed
    1. van Veen R. L., Verkruysse W., Sterenborg H. J., “Diffuse-reflectance spectroscopy from 500 to 1060 nm by correction for inhomogeneously distributed absorbers,” Opt. Lett. 27(4), 246–248 (2002). 10.1364/OL.27.000246 - DOI - PubMed
    1. Achilefu S., et al. , “Novel receptor-targeted fluorescent contrast agents for in vivo tumor imaging,” Invest. Radiol. 35(8), 479–485 (2000). 10.1097/00004424-200008000-00004 - DOI - PubMed
    1. Gurjar R. S., et al. , “Imaging human epithelial properties with polarized light-scattering spectroscopy,” Nat. Med. 7(11), 1245–1248 (2001). 10.1038/nm1101-1245 - DOI - PubMed
    1. Wang Z., et al. , “Tissue refractive index as marker of disease,” J. Biomed. Opt. 16(11), 116017 (2011). 10.1117/1.3656732 - DOI - PMC - PubMed

Publication types