. 2014 Feb;36(1):383-93.
doi: 10.1007/s11357-013-9571-6. Epub 2013 Aug 11.

Thigh muscle volume in relation to age, sex and femur volume

Affiliations

Thigh muscle volume in relation to age, sex and femur volume

T M Maden-Wilkinson et al. Age (Dordr). 2014 Feb.

Abstract

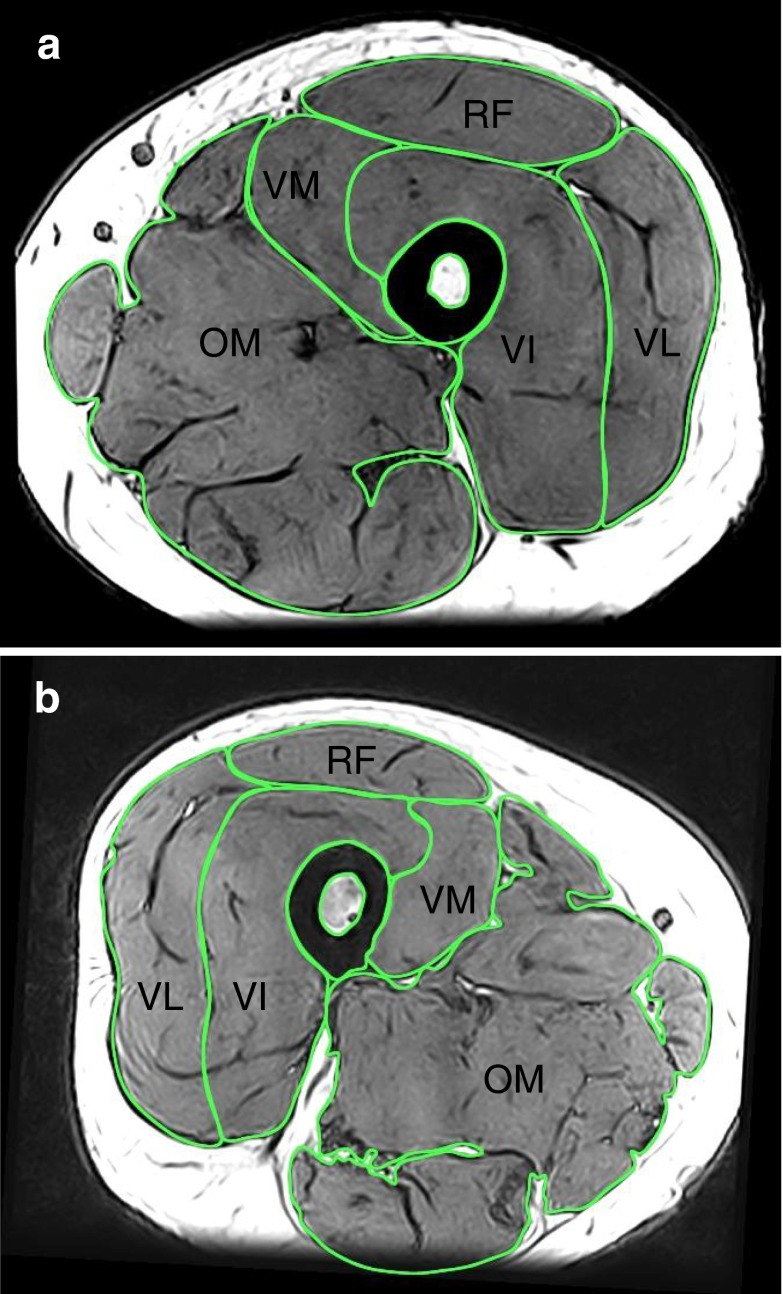
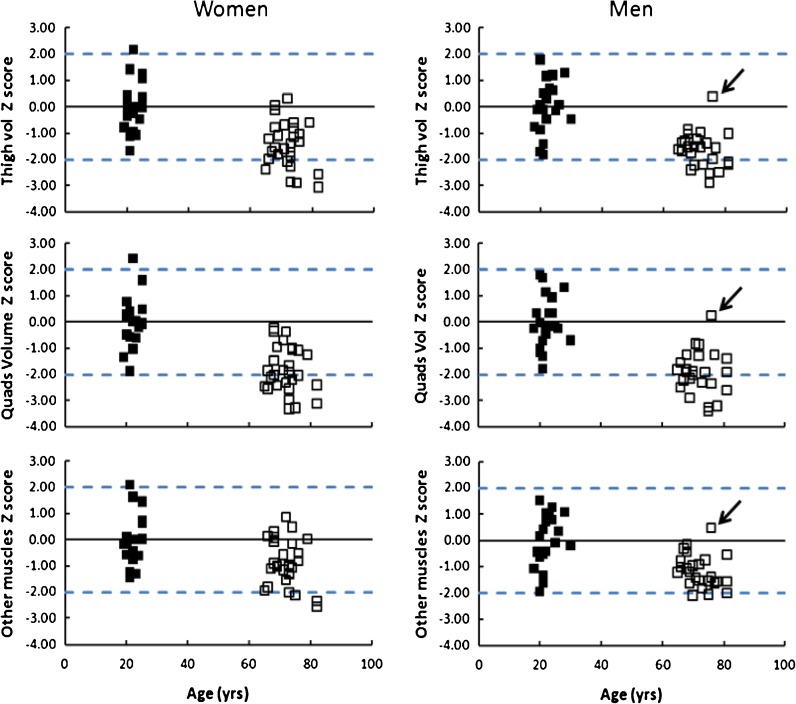
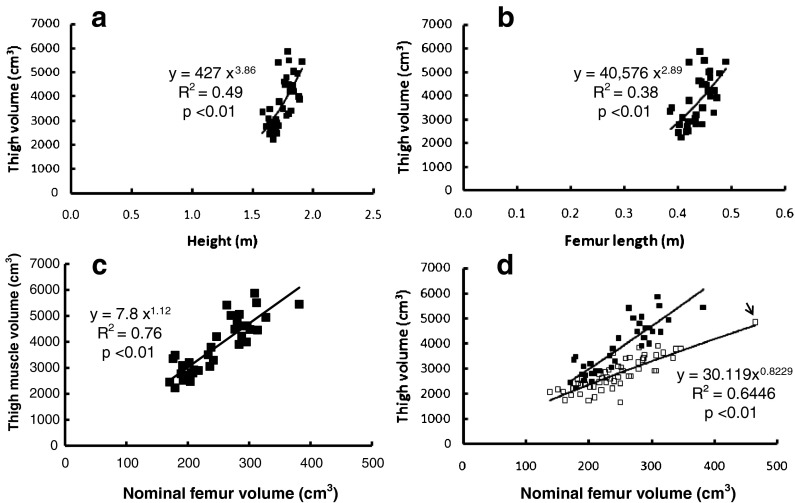
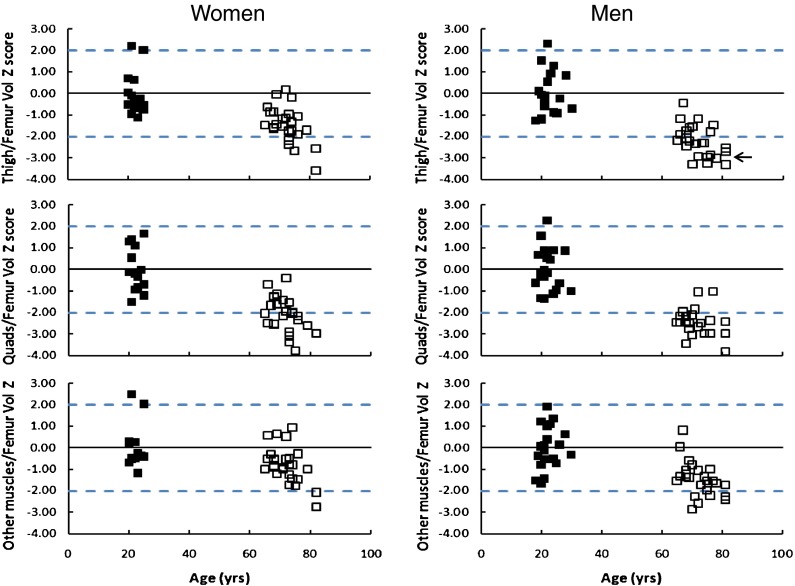
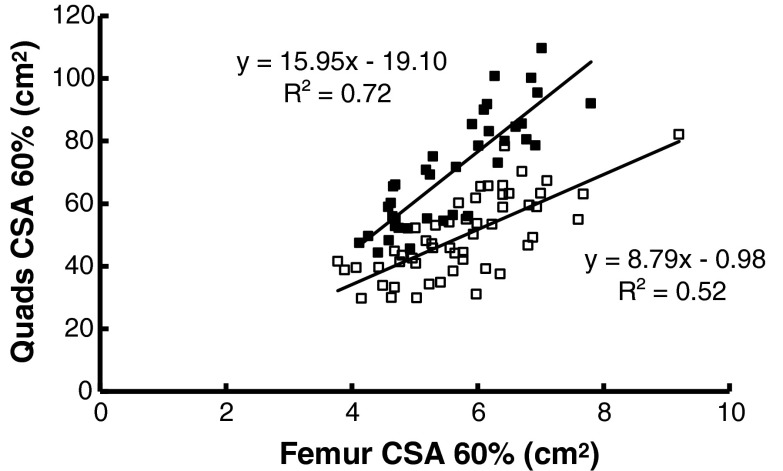
Secular changes and intra-individual differences in body shape and size can confound cross-sectional studies of muscle ageing. Normalising muscle mass to height squared is often suggested as a solution for this. We hypothesised that normalisation of muscle volume to femur volume may be a better way of determining the extent of muscle lost with ageing (sarcopenia). Thigh and femur muscle volumes were measured from serial magnetic resonance imaging sections in 20 recreationally active young men (mean age 22.4 years), 25 older men (72.3 years), 18 young women (22.1 years) and 28 older women (72.0 years). There were no age-related differences in femur volume. The relationship between thigh muscle volume and femur volume (R (2) = 0.76; exponent of 1.12; P < 0.01) was stronger than that with height (R (2) = 0.49; exponent of 3.86; P < 0.01) in young participants. For young subjects, the mean muscle/bone ratios were 16.0 and 14.6 for men and women, respectively. For older men and women, the mean ratios were 11.6 and 11.5, respectively. The Z score for the thigh muscle/bone volume ratio relative to young subjects was -2.2 ± 0.7 for older men and -1.4 ± 0.8 for older women. The extent of sarcopenia judged by the muscle/bone ratio was approximately twice that determined when normalising to height squared. These data suggest that the muscle/bone ratio captures the intra-individual loss of muscle mass during ageing, and that the age-related loss of muscle mass may be underestimated when normalised to height squared. The quadriceps seems relatively more affected by ageing than other thigh muscles.


Figures

Fig. 1
Fig. 1
Magnetic resonance image of the thigh of a a young man (22 years) and b an older man (76 years) at 60 % of femur length. Highlighted are the cross-sectional areas of the femur, RF rectus femoris, VL vastus lateralis, VI vastus intermedius, VM vastus medialis and OM other muscles
Fig. 2
Fig. 2
Muscle volume Z scores as a function of age. Z scores (for calculation, see “Methods”) for the total thigh muscle volume, quadriceps and hamstring muscles. The mean values for the young subjects (0, solid line) and ±2 SD (dashed lines) are shown
Fig. 3
Fig. 3
Relationship between thigh muscle volume as a function of a height and b femur length and c nominal femur volume (cross-sectional area multiplied by length) in young people and d nominal femur volume for all young subjects (solid symbols; as in c) and that of all older subjects (open symbols) both p < 0.01
Fig. 4
Fig. 4
Z scores (for calculation, see “Methods”) for muscle volume divided by femur volume as a function of age. Left panels are the women, the right panels, men. The mean values for the young subjects (0, solid line) and ±2 SD (dashed lines) are shown
Fig. 5
Fig. 5
Relationship between quadriceps muscle cross-sectional area (Quads CSA) and femur cross-sectional area (Femur CSA) measured at 60 % femur length. Young subjects: solid symbols; older subjects: open symbols

References

    1. Ahlborg HG, Johnell O, Turner CH, et al. Bone loss and bone size after menopause. N Eng J Med. 2003;349:327–334. doi: 10.1056/NEJMoa022464. - DOI - PubMed
    1. Allen MD, Mcmillan SJ, Klein CS, et al. Differential age-related changes in bone geometry between the humerus and the femur in healthy men. Aging Dis. 2011;2:1–8. - PMC - PubMed
    1. Andersen JL. Muscle fibre type adaptation in the elderly human muscle. Scand J Med Sci Sports. 2003;13:40–47. doi: 10.1034/j.1600-0838.2003.00299.x. - DOI - PubMed
    1. Baumgartner RN, Koehler KM, Gallagher D, et al. Epidemiology of sarcopenia among the elderly in New Mexico. Am J Epidemiol. 1998;147:755–763. doi: 10.1093/oxfordjournals.aje.a009520. - DOI - PubMed
    1. Degens H. Determinants of skeletal muscle hypertrophy and the attenuated hypertrophic response at old age. J Sports Med Doping Stud. 2012;S1:003.

Publication types

LinkOut - more resources