. 2013 Sep 19;501(7467):435-8.
doi: 10.1038/nature12467. Epub 2013 Aug 11.

Evolutionary implications of a third lymphocyte lineage in lampreys

Affiliations

Evolutionary implications of a third lymphocyte lineage in lampreys

Masayuki Hirano et al. Nature. .

Abstract

Jawed vertebrates (gnathostomes) and jawless vertebrates (cyclostomes) have different adaptive immune systems. Gnathostomes use T- and B-cell antigen receptors belonging to the immunoglobulin superfamily. Cyclostomes, the lampreys and hagfish, instead use leucine-rich repeat proteins to construct variable lymphocyte receptors (VLRs), two types of which, VLRA and VLRB, are reciprocally expressed by lymphocytes resembling gnathostome T and B cells. Here we define another lineage of T-cell-like lymphocytes that express the recently identified VLRC receptors. Both VLRC(+) and VLRA(+) lymphocytes express orthologues of genes that gnathostome γδ and αβ T cells use for their differentiation, undergo VLRC and VLRA assembly and repertoire diversification in the 'thymoid' gill region, and express their VLRs solely as cell-surface proteins. Our findings suggest that the genetic programmes for two primordial T-cell lineages and a prototypic B-cell lineage were already present in the last common vertebrate ancestor approximately 500 million years ago. We propose that functional specialization of distinct T-cell-like lineages was an ancient feature of a primordial immune system.


Conflict of interest statement

The authors declare no competing financial interests.

Figures
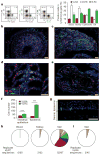
Figure 1
Figure 1. Tissue distribution of VLRA+, VLRB+ and VLRC+ lymphocytes
a, Flow cytometric analysis of lymphocyte-gated cells stained with monoclonal antibodies specific for VLRA (R110), VLRB (4C4) and VLRC (3A5) (left). Lymphocyte population in lamprey larvae (right); n = 11. b–g, Immunofluorescence staining of VLRC+ (green) and VLRA+ (red) lymphocytes in larval tissue sections, and DAPI counterstaining of nuclei (blue); scale bars, 50 μm (be, g). Shown are typhlosole surrounded by intestinal epithelium (intraepithelial lymphocytes) (b, arrows), kidneys (c), gill filaments (d; inset is a magnification of the area indicated by the dashed box), hypopharyngeal fold (e), skin (g). Lymphocyte distribution in the intestinal epithelium and skin epidermis is shown in f; n = 5 larvae. ***P < 0.0001; error bars, s.e.m. h, Frequency of replicate VLRC sequences in indicated tissues from two larvae; replicate VLRC sequences were not shared by different tissues. i, Frequency of VLRA replicates. The numbers of clonal replicates are colour-coded: red, 22; blue, 7; green, 5; pale orange, 4; yellow, 3; orange, 2.
Figure 2
Figure 2. Antigen and mitogen responses
a, Lymphocyte proliferation in typhlosole before (n = 6) and 28 days after (n = 3) B. anthracis exosporium immunization measured by EdU (5-ethynyl-2′-deoxyuridine) incorporation. b, Lymphocyte proliferation 9 days after PHA stimulation (n = 7). c, Lymphocyte numbers in blood after PHA stimulation (n = 7). d, Western blot (WB) analysis of plasma before (day 0 (D0)) and 9 days after (D9) PHA stimulation. kDa, kilodaltons. *P < 0.05, **P < 0.01, ***P < 0.001; error bars, s.e.m.
Figure 3
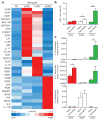
Figure 3. Gene-expression profiles of VLRA+, VLRB+ and VLRC+ lymphocytes and their poly(I:C) responses
a, Relative transcript levels of the indicated genes were measured by quantitative PCR for purified VLRA+, VLRB+, VLRC+ and triple negative (TN) lymphocyte populations and compiled into a heat map (n = 5). b, Proliferative responses to in vivo poly(I:C) stimulation, measured by EdU incorporation (n = 3). c–e, Cytokine expression of purified blood lymphocytes before and 9 days after poly(I:C) treatment of lamprey larvae measured by quantitative PCR (n = 3): c, IL-16, d, IL-17 and e, IL-8. *P < 0.05, **P < 0.01; error bars, s.e.m.
Figure 4
Figure 4. Analysis of VLRC, VLRA and VLRB transcription and assembly
a, Thymoid procurement site before (top) and after (middle) laser-capture micro-dissection; CDA1-expressing cells (blue) were detected by RNA in situ hybridization in an adjacent section (bottom). b, Proportion of non-productive sequences among assembled VLRC genes (top) and partially assembled genes among non-productive VLRC sequences (bottom). c, Schematic of VLR genes before (top) and after (bottom) assembly. Forward (F) and reverse (R) primer locations and predicted PCR product sizes are indicated. The F2 and R2 primer pair (grey) was used to amplify VLRB transcripts. d, Total RNA extracted from purified lymphocyte populations was amplified by RT–PCR (PCR with reverse transcription). bp, base pairs; GL, germline transcripts; M, transcripts of assembled VLR genes. e, Assembly of VLRB, VLRA and VLRC genes identified by PCR of genomic DNA. f, Schematic model of VLRA and VLRC assembly during the development of bi-potent precursor cells in the ‘thymoid’. Orange bars indicate VLRC assembly, green bars indicate VLRA assembly (solid coloured bars, productive assembly; bars with a cross, non-productive assembly). Green and orange chains represent leucine-rich repeat modules of VLRA and VLRC, respectively. Red text represents genes that are assembled. Grey text represents genes that are not assembled. Dagger symbols represent cell death.

References

    1. Flajnik MF, Kasahara M. Origin and evolution of the adaptive immune system: genetic events and selective pressures. Nature Rev Genet. 2010;11:47–59. - PMC - PubMed
    1. Litman GW, Rast JP, Fugmann SD. The origins of vertebrate adaptive immunity. Nature Rev Immunol. 2010;10:543–553. - PMC - PubMed
    1. Tonegawa S. Somatic generation of antibody diversity. Nature. 1983;302:575–581. - PubMed
    1. Davis MM, Bjorkman PJ. T-cell antigen receptor genes and T-cell recognition. Nature. 1988;334:395–402. - PubMed
    1. Guo P, et al. Dual nature of the adaptive immune system in lampreys. Nature. 2009;459:796–801. - PMC - PubMed

Publication types