. 2013 Sep;15(9):1123-30.
doi: 10.1038/ncb2818. Epub 2013 Aug 11.

Tissue damage detection by osmotic surveillance

Affiliations

Tissue damage detection by osmotic surveillance

Balázs Enyedi et al. Nat Cell Biol. 2013 Sep.

Abstract

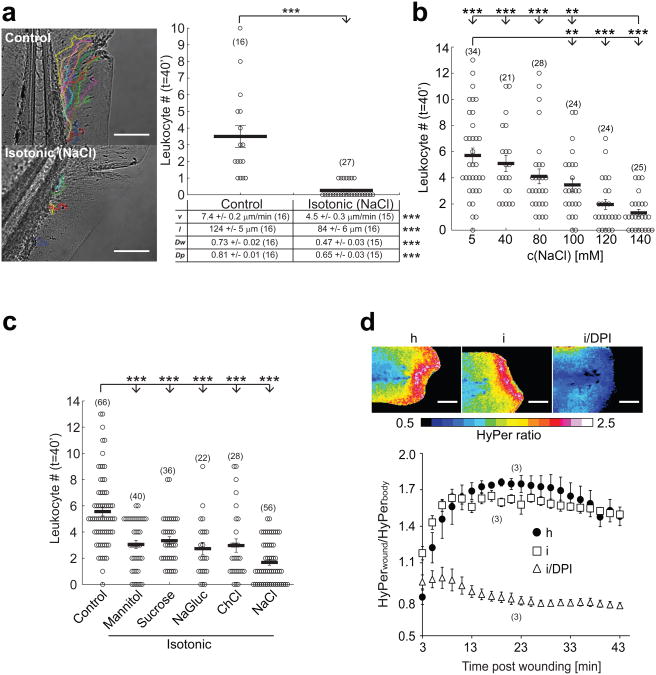
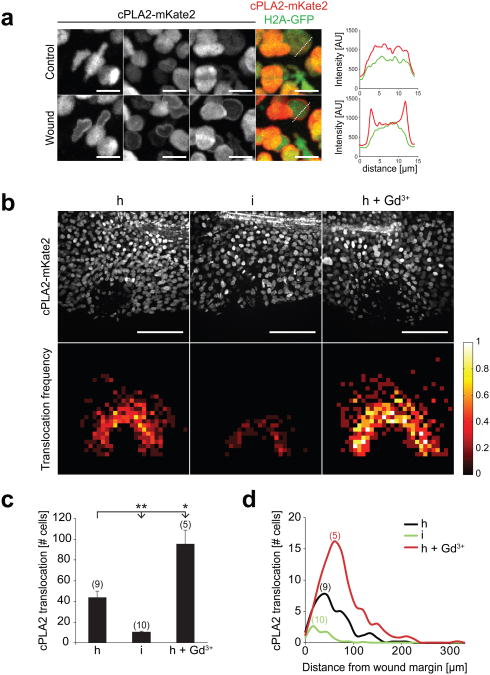
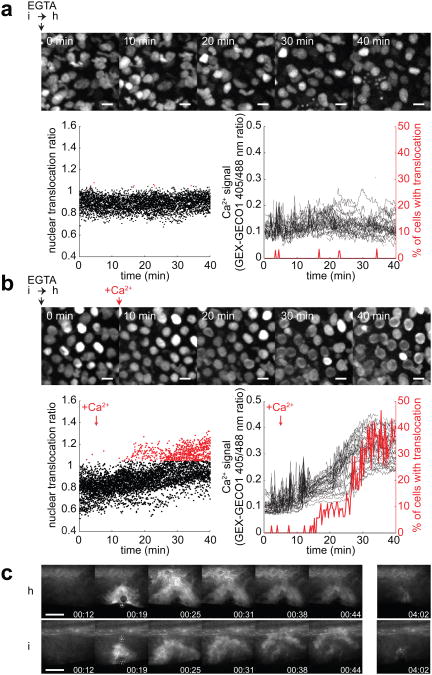
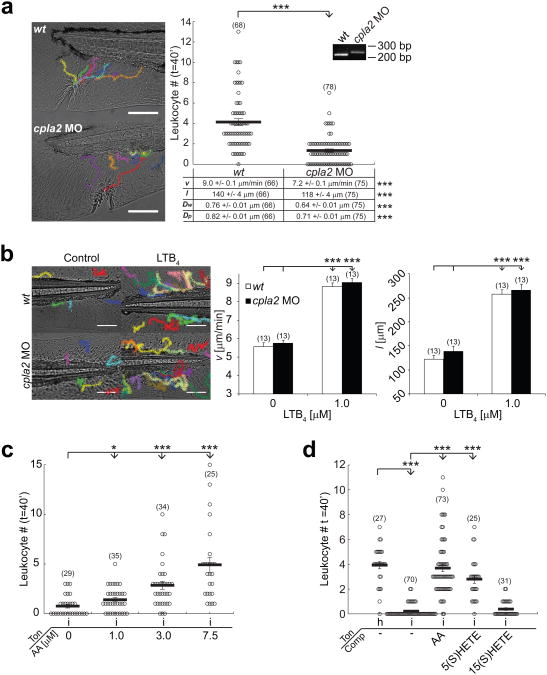
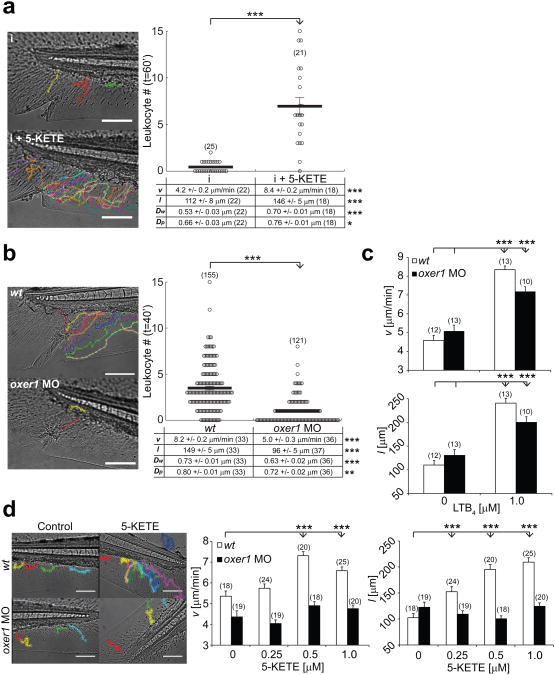
How tissue damage is detected to induce inflammatory responses is unclear. Most studies have focused on damage signals released by cell breakage and necrosis. Whether tissues use other cues in addition to cell lysis to detect that they are damaged is unknown. We find that osmolarity differences between interstitial fluid and the external environment mediate rapid leukocyte recruitment to sites of tissue damage in zebrafish by activating cytosolic phospholipase a2 (cPLA2) at injury sites. cPLA2 initiates the production of non-canonical arachidonate metabolites that mediate leukocyte chemotaxis through a 5-oxo-ETE receptor (OXE-R). Thus, tissues can detect damage through direct surveillance of barrier integrity, with cell swelling probably functioning as a pro-inflammatory intermediate in the process.


Figures

Fig. 1
Fig. 1
Hypotonicity is required for rapid leukocyte recruitment to larval zebrafish tail fin wounds. (a) Recruitment of leukocytes to incisional tail fin wounds imaged in zebrafish larvae by light transmission microscopy. During wounding and subsequent imaging, larvae were kept either in normal, hypotonic E3 embryo medium (‘Control’, containing 5 mM NaCl) or in embryo medium that had been adjusted to the common extracellular tonicity of vertebrates (∼270-300 mOsm) by addition of 140 mM NaCl (‘Isotonic (NaCl)’, 145 mM NaCl). Left panel, representative leukocyte tracks capturing all visible cell movements within 40 min after injury. Graph: mean number of leukocytes reaching the wound within t = 40 min after injury. Table: quantification of mean velocity (v), pathlength (l), wound directionality (Dw), and path persistence (Dp). (b) Mean leukocyte recruitment to larval tail fin wounds within 40 min after injury plotted vs. salt concentration of the medium. (c) Mean leukocyte recruitment within 40 min after injury as a function of different isotonic medium compositions. ‘Control’, 5 mM NaCl. ‘Mannitol’, control + 270 mM Mannitol. ‘Sucrose’, control + 270 mM Sucrose. ‘NaGluc’, control + 135 mM sodium gluconate. ‘ChCl’, control + 135 mM choline chloride. ‘NaCl’, control + 135 mM NaCl. (d) HyPer imaging of wound margin H2O2 production in response to wounding in hypotonic (h), isotonic (i), or isotonic medium + 100 μM of the NADPH oxidase inhibitor diphenyl iodonium chloride (i/DPI). Upper panel, representative HyPer-ratio images. Red, high [H2O2]. Blue, low [H2O2]. Lower panel, normalized HyPer-ratio as a function of time after wounding. Number of larvae (n) used for the analyses is given in parentheses on the graphs. Error bars, SEM. **, t-test p< 0.005. ***, t-test p<0.0005. Scale bar, 100 μm.
Fig. 2
Fig. 2
Hypotonicity locally activates cPLA2 at the wound site. (a) Confocal imaging of injury induced cPLA2-mKate2 translocation to nuclear membranes in live zebrafish larvae. Left panel, representative of maximal intensity projections showing cPLA2-mKate2 localization before (upper image panel) or 30 sec after (lower image panel) laser injury of the tail fin. N.b. the cell cytoplasm and cell periphery are not visible, since cPLA2 localizes exclusively to the nucleus. These magnifications were derived from tissue regions near the (prospective) injury site. Outmost right image column, superposition of nuclear H2A-GFP (green) cPLA2-mKate2 (red) fluorescence. Right panel: representative intensity profile plots of H2A-GFP (green) and cPLA2-mKate2 (red) derived from neighbouring image data (dashed lines). Scale bar, 10 μm. (b) Upper panel: full field of view images of cPLA2-mKate2 fluorescence in live tail fins subjected to hypotonic (h), isotonic (i), or hypotonic laser injury in the presence of 500 μM Gd3+ (h+Gd3+) 30 sec post wounding. Lower panel: average cPLA2-mKate2 translocation density projected onto normalized wound coordinates at indicated conditions (see Methods section for details). Colour-scale, relative translocation densities (white=high, red=low, black=none). Scale bar: 100 μm. (c) Average number of nuclei per animal that show cPLA2-mKate2 translocation in response to wounding at indicated conditions. Number of larvae (n) used for the analyses is given in parentheses on the graphs. Error bars: SEM. *: t-test p< 0.05. **: t-test p< 0.005. (d) Average number of nuclei per animal with cPLA2-mKate2 translocation in response to wounding at indicated conditions shown as a function of distance from the wound margin.
Fig. 3
Fig. 3
Extracellular Ca2+ is required for cPLA2 activation. (a-b) Parallel confocal imaging of cPLA2-mKate2 and cytosolic Ca2+ signals using the GEX-GECO1 Ca2+ indicator in live zebrafish larvae. Larvae were wounded manually in isotonic medium without Ca2+, supplemented with 1mM EGTA and mounted in a small volume of low melting isotonic agarose. Hypotonic medium without Ca2+, supplemented with 1mM EGTA was added on top of the isotonic agar pad at t = 0 min. cPLA2-mKate2 fluorescence (montage) and GEX-GECO1 405nm/488nm excitation ratio images were acquired over the indicated time without (a) or with readdition of CaCl2 to reach a final [Ca2+]free of 0.3 mM at 5 min (b). Left panel, cPLA2-mKate2 perinuclear translocation as a function of time, measured by automatic perinuclear/nuclear fluorescence ratio calculation (see Methods section for details). Points represent individual nuclei with threshold of translocation ratio empirically set to 1.05 (red). Right panel, cytosolic Ca2+ signal of the same cells (left axis) and the percentage of cells with a translocation ratio over 1.05 (right axis, red) as a function of time. Scale bar, 10 μm. (c) Cystosolic Ca2+ measurements in larval tail fins of live zebrafish expressing GCaMP3 during UV-laser induced wounding at 19 sec, under hypotonic (‘h’) or isotonic (‘i’) conditions. Scale bar, 100 μm.
Fig. 4
Fig. 4
cPLA2 is required for rapid leukocyte recruitment to larval zebrafish tail fin wounds. (a) Average recruitment and migratory parameters of leukocytes within 40 min after tail fin wounding of wt and cpla2 morphant larvae. Inset: RT-PCR on RNA derived from wt and cpla2 morphant larvae using cpla2 specifc primers (b) Migratory parameters (v, l) of leukocytes tracked for 60 min in unwounded wt or cpla2 morphant larvae in response to bath application of LTB4. (c) Leukocyte recruitment to isotonic tail fin incisions at indicated concentrations of arachidonic acid (AA) within 40 min. (d) Leukocyte recruitment (within 40 min) in response to tail fin incisions in hypotonic (‘h’) or isotonic (‘i’) medium tonicities (‘Ton’) in the presence or absence of AA, 5(S)-HETE, or 15(S)-HETE. Indicated compounds (‘Comp’) were used at 5 μM. Number of larvae (n) used for the analyses is given in parentheses on the graphs. Error bars, SEM. *, t-test p< 0.05. **, t-test p< 0.005. ***, t-test p<0.0005. Scale bar, 100 μm.
Fig. 5
Fig. 5
OXE-R is required for rapid leukocyte recruitment to larval zebrafish tail fin wounds. (a) Average recruitment and migratory parameters of leukocytes within 60 min after isotonic tail fin wounding of wt larvae in the presence or absence of 2 μM 5-KETE in the supernatant medium (see Methods section for details). (b) Average recruitment and migratory parameters of leukocytes within 40 min after hypotonic tail fin wounding of wt and oxer1 morphant larvae. (c) Migratory parameters (v, l) of leukocytes tracked for 60 min in unwounded wt or oxer1 morphant larvae in response to bath application of LTB4. (d) Migratory parameters of leukocytes tracked for 60 min in unwounded wt or oxer1 morphant larvae in response to bath application of 5-KETE. Number of larvae (n) used for the analyses is given in parentheses on the graphs. Error bars, SEM. *, t-test p< 0.05. **, t-test p< 0.005. ***, t-test p<0.0005. Scale bar, 100 μm.

References

    1. Seong SY, Matzinger P. Hydrophobicity: an ancient damage-associated molecular pattern that initiates innate immune responses. Nat Rev Immunol. 2004;4:469–478. - PubMed
    1. Zhao M, et al. Electrical signals control wound healing through phosphatidylinositol-3-OH kinase-gamma and PTEN. Nature. 2006;442:457–460. - PubMed
    1. Gilljam H, Ellin A, Strandvik B. Increased bronchial chloride concentration in cystic fibrosis. Scand J Clin Lab Invest. 1989;49:121–124. - PubMed
    1. Joris L, Dab I, Quinton PM. Elemental composition of human airway surface fluid in healthy and diseased airways. Am Rev Respir Dis. 1993;148:1633–1637. - PubMed
    1. Redd MJ, Cooper L, Wood W, Stramer B, Martin P. Wound healing and inflammation: embryos reveal the way to perfect repair. Philosophical transactions of the Royal Society of London Series B, Biological sciences. 2004;359:777–784. - PMC - PubMed

Publication types

MeSH terms