. 2013 Dec;9(6):833-46.
doi: 10.1007/s12015-013-9464-1.

In vivo ectopic implantation model to assess human mesenchymal progenitor cell potential

Affiliations

In vivo ectopic implantation model to assess human mesenchymal progenitor cell potential

Ander Abarrategi et al. Stem Cell Rev Rep. 2013 Dec.

Abstract

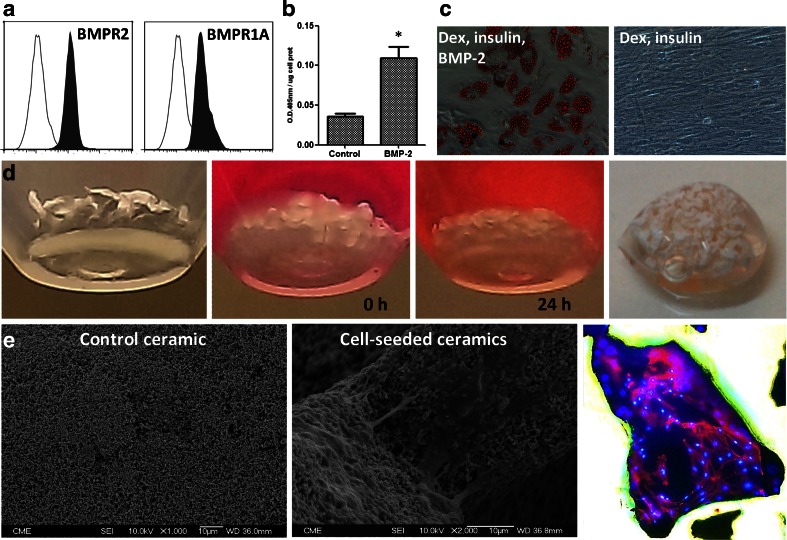
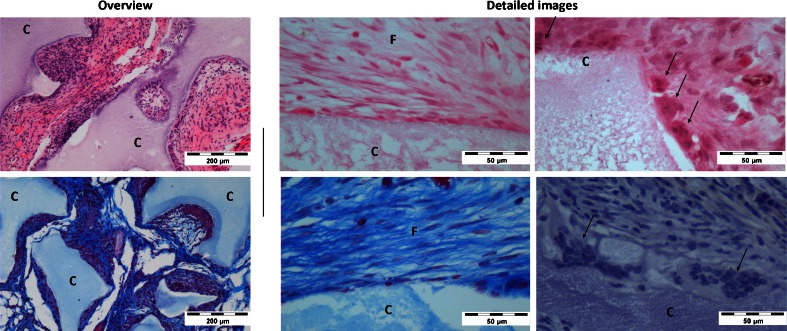
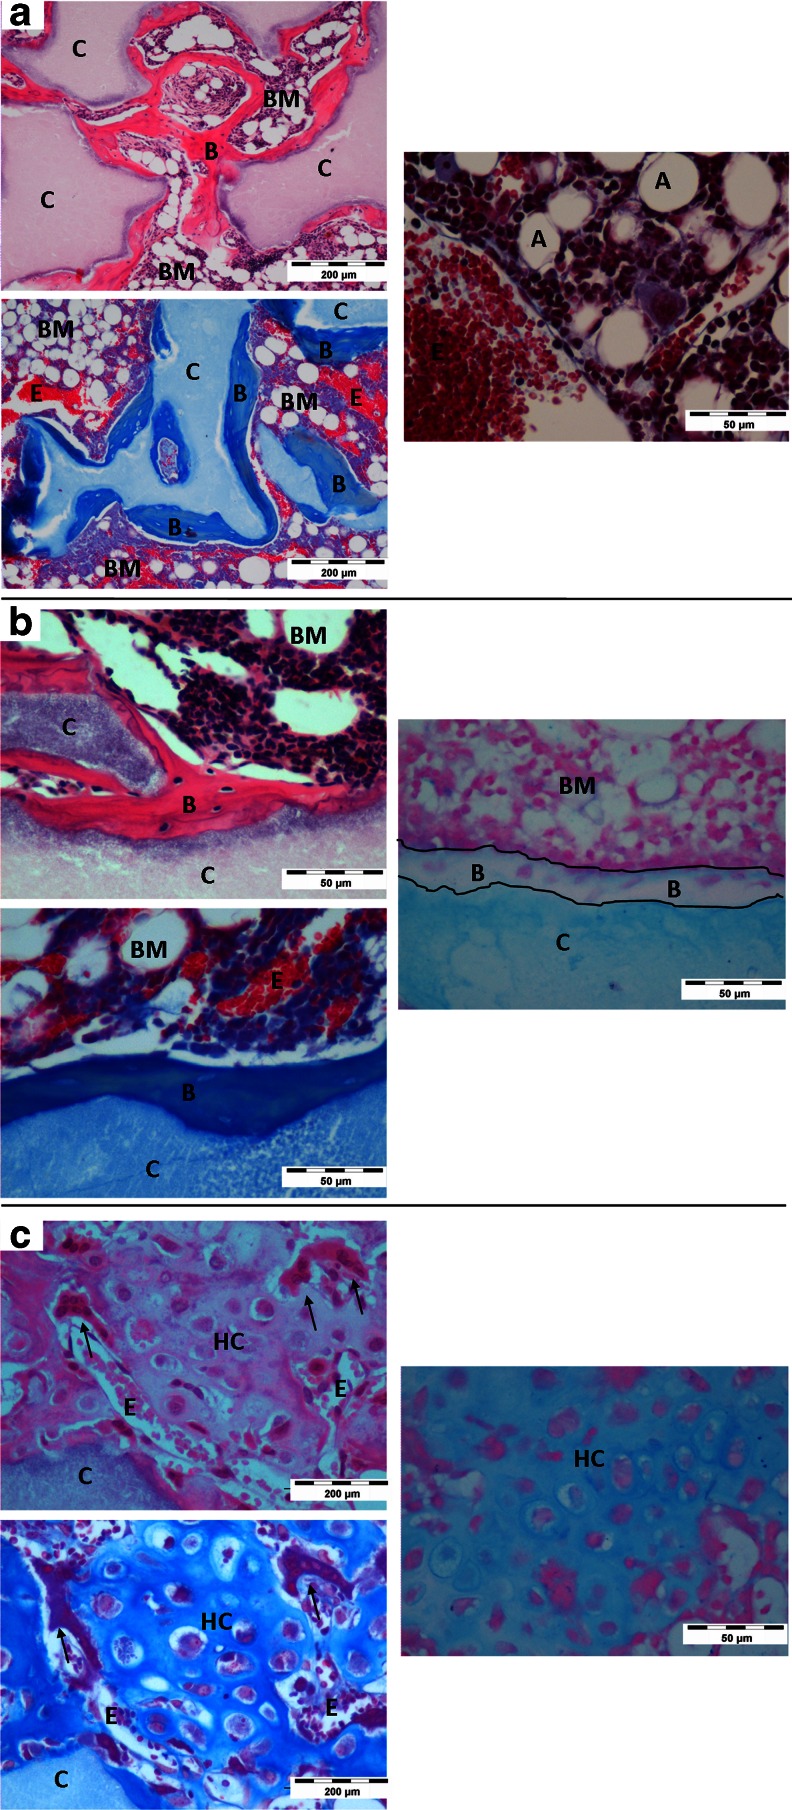
Clinical interest on human mesenchymal progenitor cells (hMPC) relies on their potential applicability in cell-based therapies. An in vitro characterization is usually performed in order to define MPC potency. However, in vitro predictions not always correlate with in vivo results and thus there is no consensus in how to really assess cell potency. Our goal was to provide an in vivo testing method to define cell behavior before therapeutic usage, especially for bone tissue engineering applications. In this context, we wondered whether bone marrow stromal cells (hBMSC) would proceed in an osteogenic microenvironment. Based on previous approaches, we developed a fibrin/ceramic/BMP-2/hBMSCs compound. We implanted the compound during only 2 weeks in NOD-SCID mice, either orthotopically to assess its osteoinductive property or subcutaneously to analyze its adequacy as a cell potency testing method. Using fluorescent cell labeling and immunohistochemistry techniques, we could ascertain cell differentiation to bone, bone marrow, cartilage, adipocyte and fibrous tissue. We observed differences in cell potential among different batches of hBMSCs, which did not strictly correlate with in vitro analyses. Our data indicate that the method we have developed is reliable, rapid and reproducible to define cell potency, and may be useful for testing cells destined to bone tissue engineering purposes. Additionally, results obtained with hMPCs from other sources indicate that our method is suitable for testing any potentially implantable mesenchymal cell. Finally, we propose that this model could successfully be employed for bone marrow niche and bone tumor studies.


Figures

Fig. 1
Fig. 1
In vitro testing. a Flow cytometry study of BMP-2 receptor expression in hBMSCs (white filled, control antibody; black filled, tested antibody). b Colorimetric measurement of ALP activity as an early osteogenic marker. Assay performed at 7 days of BMP-2 treatment shows higher levels of ALP in BMP-2 treated hMSCs. (*p < 0.01). c Oil red staining for detection of lipid droplets. Assay performed at 14 days shows that only dexametasone, insulin and BMP-2 treatment induces adipogenic differentiation. d Implant manufacturing process. Gross appearance of ceramic material in the bottom of 50 mL falcon tube, at t = 0 h and t = 24 h. Last image corresponds to material after fibrin coating. e Surface characterization of control ceramic and cell-seeded ceramic samples before fibrin coating. SEM micrographs show porous surface structure of control ceramics (left) and cells adhered and forming filopodia in cell-seeded samples (center). Direct fluorescent microscope image of fluorescent actin cytoskeleton (red) and nucleus (blue) detection shows cell-spreading on cell-seeded ceramic (right)
Fig. 2
Fig. 2
Orthotopic implantations. a microCT images of cranial defects. From left to right: Empty defect at surgery; Empty defect at 14 days; Fibrin/ceramic/BMP-2/hBMSC filled defect at 14 days. Up, 3D reconstruction; Down, coronal plane indicated with a line in 3D reconstruction; Arrows indicate limits of the lesion. b details of H&E staining showing bone and cartilage formation. c Details of immunostaining with anti-human vimentin. Note human cells forming bone and cartilage tissues. d micro CT images of femur defect. 3D reconstruction of empty femur defect at surgery and Fibrin/ceramic/BMP-2/hBMSC filled defect at 14 days. e details of H&E staining showing bone marrow formation. f Details of immunostaining with anti-human vimentin
Fig. 3
Fig. 3
Implant characterization by image techniques. a In vivo T1-weighted MRI study the day at end point. Transversal view. Blue line indicates implant location. Upper images obtained before gadolinium injection. Note bright areas (arrowheads) inside BMP-2 charged implant, which could be attributed to lipidic tissue corresponding to newly formed mature bone marrow. Lower images obtained after gadolinium contrast agent injection. Note higher signal intensity only inside BMP-2 charged implant, which corresponds to gadolinium retention in microvascularization. b Gross morphology of freshly harvested samples. c microCT study. Note high amount of radio-opaque tissue formation in BMP-2 samples (right), which corresponds to newly formed bone. Radio-opaque material in control sample (left) corresponds to implanted ceramic
Fig. 4
Fig. 4
Histology of control implants. Images are provided at two different magnifications. Hematoxilin/eosin (top) and Masson’s trichrome (bottom) staining are shown. Note only fibrous tissue formation. (Arrows, Osteoclasts; C, ceramic; F, Fibrous tissue)
Fig. 5
Fig. 5
Histology of BMP-2 loaded implants. Hematoxilin/Eosin (Up) and Masson’s Trichrome (Down) staining is shown. a Overview. Note the existence of mature bone marrow, with adipocytes and erythrocytes, which are intensely red-colored in Masson staining in images at low magnification. Detailed image shows bone marrow structure. b Bone line directly formed surrounding ceramic materials in detail. Note that in Alcian blue staining (right), bone, which is here delimited with black lines, remains unstained. Also note unspecific Alcian Blue staining of implanted ceramic material. c Images of hypertrophic chondroblastic tissue observed in implant perifery. Note the presence of multinucleated cells (arrows) in these areas. Alcian blue staining (right) shows calcified extracellular matrix stained in blue-green color due to matrix proteoglycans. (C, Ceramic; B, Bone; BM, Bone Marrow; A, Adipocyte; E, Erythrocytes; HC, Hypertrophic Cells)
Fig. 6
Fig. 6
Localization of implanted hBMSCs. a Fibrous tissue. b Bone marrow. c Calcified chondroblastic tissue. d Bone. Up) Merged images from confocal microscopy were DiD labeled hBMSCs are observed in red and nuclei in blue. D and C also add bright field image to enhance contrast and visualize structure of calcified tissues. (continuous line, Ceramic; Dotted line, Bone; Dotted line, Calcified chondroblastic tissue). Down) Images of immunohistochemical studies showing in vivo hBMSC differentiation. Brown precipitate denotes human origin in all images. Antibody is specified in each case. (Scale bars represent 50 μm)

References

    1. Bianco P, Cao X, Frenette PS, et al. The meaning, the sense and the significance: translating the science of mesenchymal stem cells into medicine. Nature Medicine. 2013;19:35–42. doi: 10.1038/nm.3028. - DOI - PMC - PubMed
    1. Wang S, Qu X, Zhao RC. Clinical applications of mesenchymal stem cells. Journal of Hematology & Oncology. 2012;5:19. doi: 10.1186/1756-8722-5-19. - DOI - PMC - PubMed
    1. Otto WR, Wright NA. Mesenchymal stem cells: from experiment to clinic. Fibrogenesis Tissue Repair. 2011;4:20. doi: 10.1186/1755-1536-4-20. - DOI - PMC - PubMed
    1. Si YL, Zhao YL, Hao HJ, Fu XB, Han WD. MSCs: biological characteristics, clinical applications and their outstanding concerns. Ageing research reviews. 2011;10:93–103. doi: 10.1016/j.arr.2010.08.005. - DOI - PubMed
    1. Backly, R., & Cancedda, R. (2010). Bone marrow stem cells in clinical application: harnessing paracrine roles and niche mechanisms. Bioreactor Systems for Tissue Engineering II, 265–292. - PubMed

Publication types

LinkOut - more resources