. 2013 Aug 15;27(16):1787-99.
doi: 10.1101/gad.223834.113. Epub 2013 Aug 9.

Lamin B1 depletion in senescent cells triggers large-scale changes in gene expression and the chromatin landscape

Affiliations

Lamin B1 depletion in senescent cells triggers large-scale changes in gene expression and the chromatin landscape

Parisha P Shah et al. Genes Dev. .

Abstract

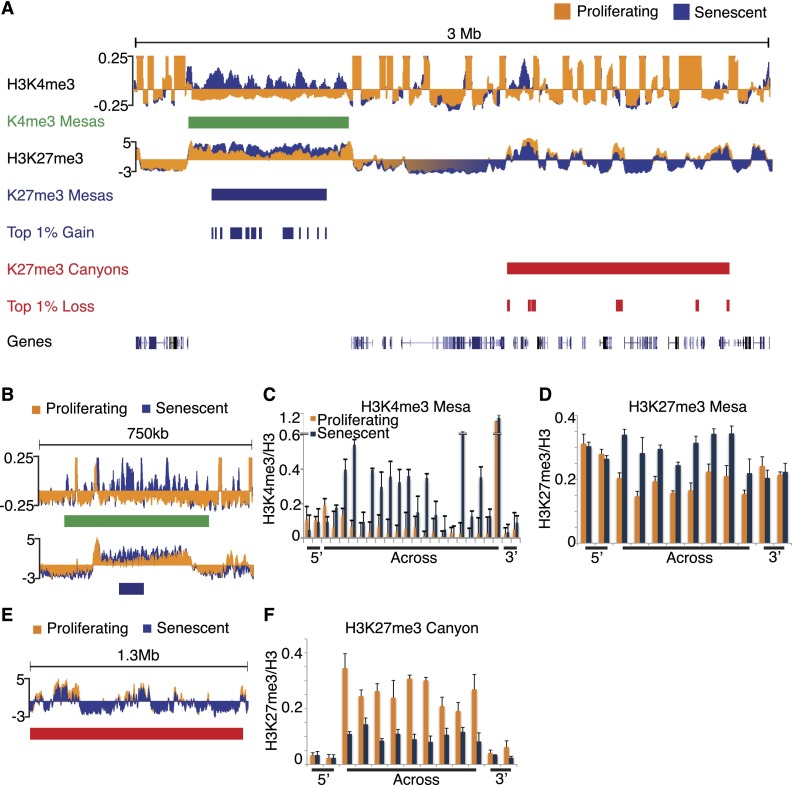
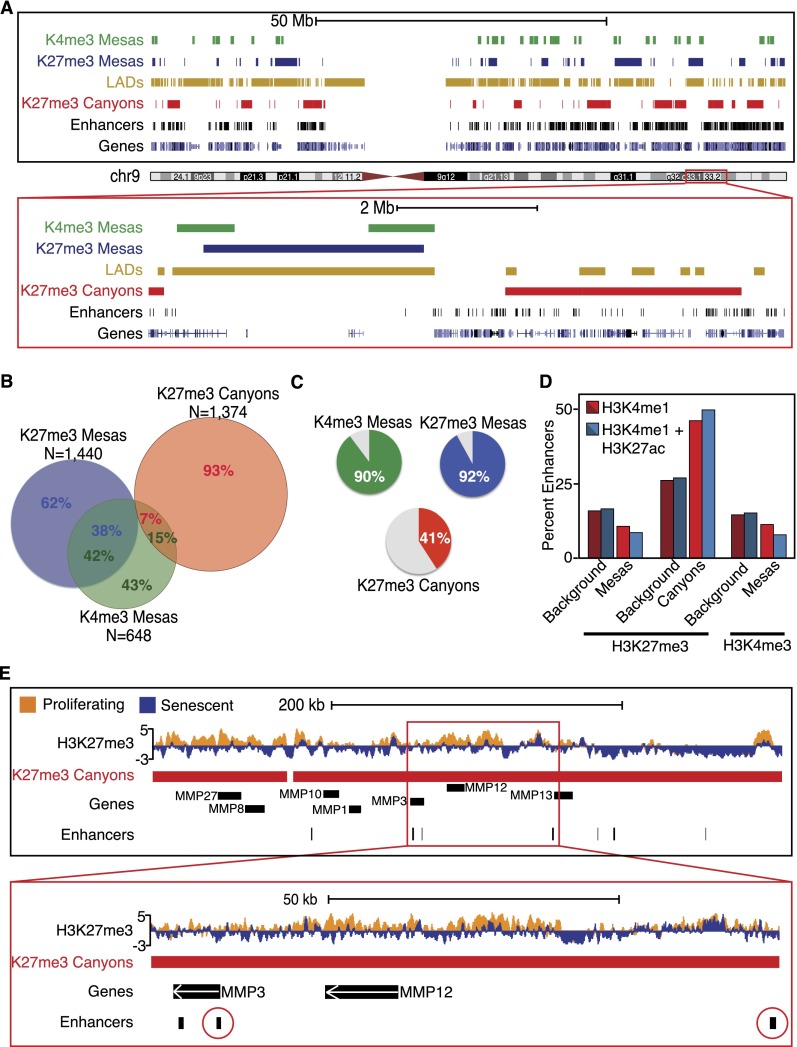
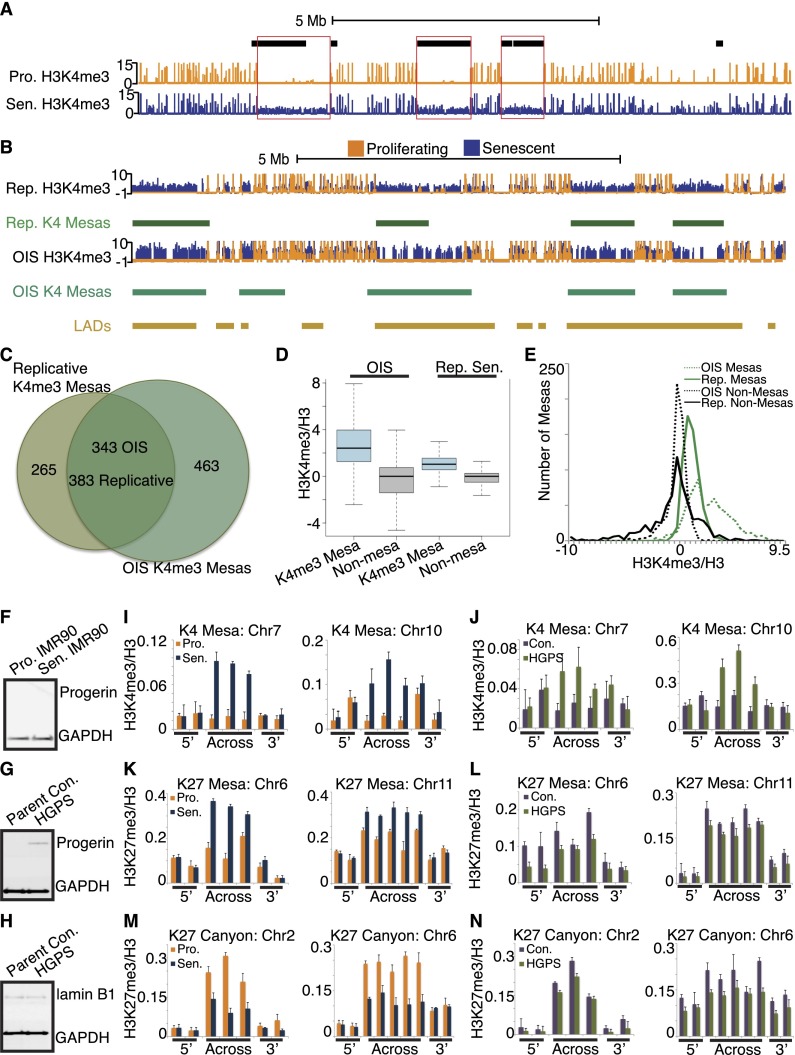
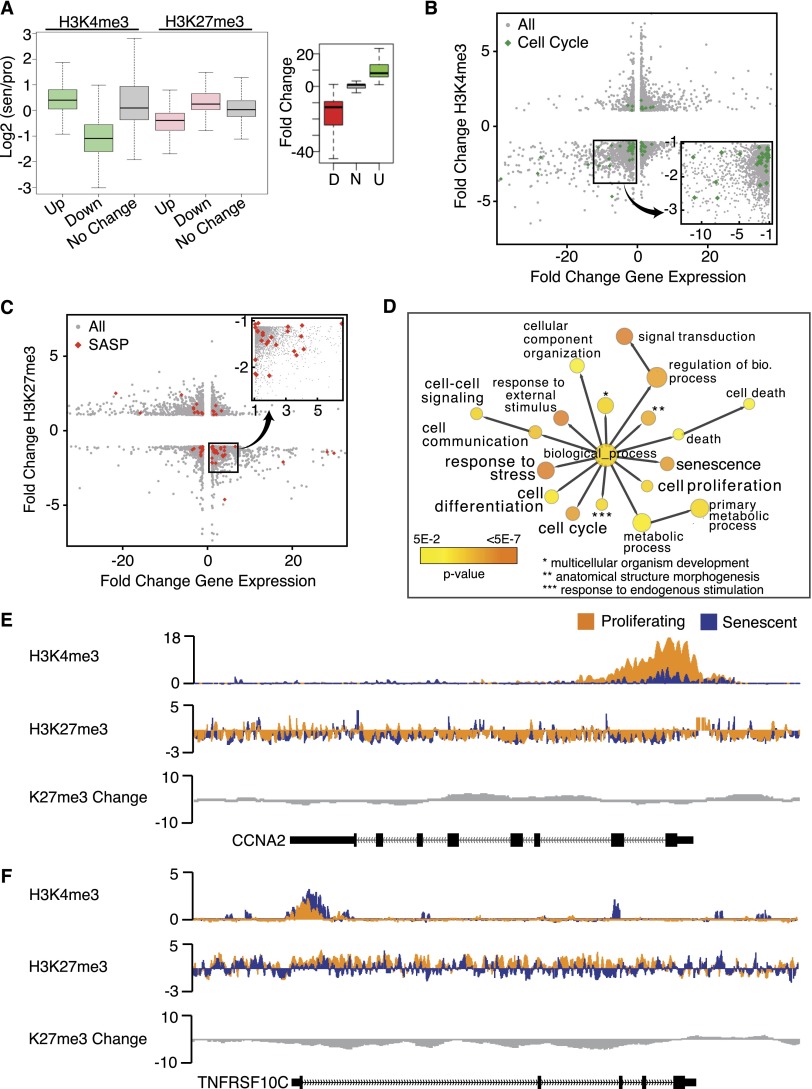
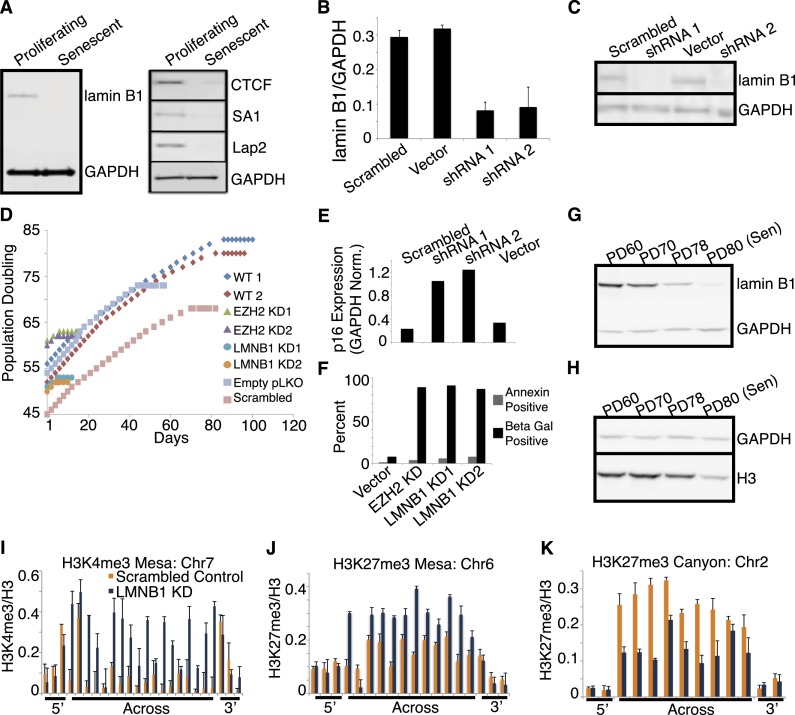
Senescence is a stable proliferation arrest, associated with an altered secretory pathway, thought to promote tumor suppression and tissue aging. While chromatin regulation and lamin B1 down-regulation have been implicated as senescence effectors, functional interactions between them are poorly understood. We compared genome-wide Lys4 trimethylation on histone H3 (H3K4me3) and H3K27me3 distributions between proliferating and senescent human cells and found dramatic differences in senescence, including large-scale domains of H3K4me3- and H3K27me3-enriched "mesas" and H3K27me3-depleted "canyons." Mesas form at lamin B1-associated domains (LADs) in replicative senescence and oncogene-induced senescence and overlap DNA hypomethylation regions in cancer, suggesting that pre-malignant senescent chromatin changes foreshadow epigenetic cancer changes. Hutchinson-Gilford progeria syndrome fibroblasts (mutant lamin A) also show evidence of H3K4me3 mesas, suggesting a link between premature chromatin changes and accelerated cell senescence. Canyons mostly form between LADs and are enriched in genes and enhancers. H3K27me3 loss is correlated with up-regulation of key senescence genes, indicating a link between global chromatin changes and local gene expression regulation. Lamin B1 reduction in proliferating cells triggers senescence and formation of mesas and canyons. Our data illustrate profound chromatin reorganization during senescence and suggest that lamin B1 down-regulation in senescence is a key trigger of global and local chromatin changes that impact gene expression, aging, and cancer.

Keywords: chromatin; gene expression; lamin B1; senescence.


Figures

Figure 1.
Figure 1.
Large-scale chromatin changes occur in the senescence genome for both histone modifications. (A) Sample tracks of H3K4me3 and H3K27me3 ChIP-seq data over a 3-Mb region of chromosome 1 (Chr1: 38,016,703–41,116,920) show major regions of gains and losses for both histone modifications. Proliferating tracks are shown in orange, and senescence tracks are shown in blue. K4me3 mesas are shown in green blocks, the top 1% gain regions and K27me3 mesas are shown in blue blocks, and the top 1% loss regions and K27me3 canyons are shown in red blocks. (B) Example of overlapped K4me3 and K27me3 mesas over a 750-kb region of chromosome 7 (Chr7: 35,060,526–35,814,473). Proliferating tracks are shown in orange, and senescence tracks are shown in blue. (C,D) ChIP-qPCR validation of the K4me3 (C) and K27me3 (D) mesas shown in B. Proliferating data are shown in orange, and senescence data are shown in blue. ChIP-qPCR primers are tiled across the entire region of the mesa and include 3′ and 5′ flanking primers. ChIP-qPCR data are shown as ratios of modification to total histone H3. ChIP-qPCR data are the average of three biological replicates, and error bars represent standard deviation from the mean. (E) Example of K27me3 canyon over a 1.3-Mb region of chromosome 6 (Chr6: 36,239,850–37,570,928). Proliferating tracks are shown in orange, and senescence tracks are shown in blue. (F) ChIP-qPCR validation of the K27me3 canyon shown in E. Proliferating data are shown in orange, and senescence data are shown in blue. ChIP-qPCR primers are tiled across the entire region of the canyon and include 3′ and 5′ flanking primers. ChIP-qPCR data are shown as ratios of modification to total histone H3. ChIP-qPCR data are the average of three biological replicates, and error bars represent the standard deviation from the mean.
Figure 2.
Figure 2.
Mesas are overlapped features that are enriched for LADs; canyons are outside of LADs and enriched for enhancers. (A, top) Representation of all K4me3 (green blocks) and K27me3 (blue blocks) mesas and K27me3 canyons (red blocks) across the whole of chromosome 9. LADs are shown in gold blocks, enhancers are shown in black blocks, and genes are shown in blue blocks at the bottom of the image. Whole-chromosome views show the enrichment for mesas within LADs and canyon formation adjacent to LADs or in general LAD-poor regions. Moreover, canyons appear to be enriched for enhancers, which are also located outside of LADs and in gene-rich regions. (Bottom) Closer view of a section of a 9.2-Mb region of chromosome 9 (Chr9: 118,000,000–127,200,000) highlights the relationship of mesas with LADs and canyons with enhancer regions. (B) Venn diagram representation of the nucleotide overlap between K4me3 mesas, K27me3 mesas, and K27me3 canyons shows a high degree of overlap between the two mesas but little overlap between canyons and mesas, highlighting the difference between the large-scale changes that are visually depicted in A. (C) Pie chart representations of the percent of nucleotides in K4me3 mesas (top left panel in green), K27me3 mesas (top right panel in blue), and K27me3 canyons (bottom panel in red) that overlap with LADs. Most nucleotides in mesas overlap with LADs (90% for K4me3 mesas and 92% for K27me3 mesas), but only 41% of canyon nucleotides overlap with LADs, highlighting the difference between the large-scale changes that are visually depicted in A. (D) Column plot representation of the overlap between K4me3 mesas, K27me3 mesas, and K27me3 canyons with two categories of enhancers (H3K4me1 shown in red and H3K4me1+H3K27ac shown in blue) highlights the enrichment of enhancers in K27me3 canyons over background measure. Mesas, as expected, are not enriched for enhancers. (E) Example track view of the MMP cluster on chromosome 11 that shows H3K27me3 loss over genes and enhancers. The bottom view is a closeup of the MMP3 and MMP12 genes (up-regulated in senescence; Chr11: 102,017,147–102,489,087) with a cluster of enhancers (circled in red) nearby that are also contained within the K27me3 canyon.
Figure 3.
Figure 3.
H3K4me3 mesas overlap hypomethylated regions in cancer; mesas form in an OIS model and HGPS. (A) Example track view of a cluster of H3K4me3 mesas on chromosome 1 (Chr1: 30,500,000–40,000,000) shows a strong degree of overlap with cancer hypomethylated regions (black blocks). Proliferating tracks are shown in orange, and senescence tracks are shown in blue. (B) Example track view of the cluster of H3K4me3 mesas between replicative senescence and OIS shows a strong degree of overlap between the mesas of the two different senescence models. Proliferating tracks are shown in orange, and senescence tracks are shown in blue. Replicative senescence mesas are shown in green blocks, OIS mesas are shown in teal blocks, and LADs are shown in gold blocks. (C) Venn diagram representing the degree of overlap between the OIS and replicative senescence mesas shows a high degree of overlap between the two sets. Note that the OIS model has almost 200 more mesas than the replicative senescence. (D) Box plot analysis of the K4me3 mesas in replicative senescence and OIS (blue boxes) compared with nonmesa control regions (gray) shows an even higher enrichment for H3K4me3 gain in OIS mesas than replicative senescence mesas. (E) Histogram analysis of the OIS and replicative senescence mesas shows a bimodal pattern for the OIS mesas (green dotted line) compared with the single mode of replicative senescence mesas (green solid line). This suggests that a subset of OIS mesas is particularly enriched for H3K4me3, even more than the replicative senescence mesas. Control nonmesa regions are shown in black solid (replicative senescence) and dotted (OIS) lines. (F,G) Western blot analysis of progerin expression in proliferating and senescent IMR90s (F) and parental control and HGPS cell strains (G) shows progerin expression only in HGPS cells, not in IMR90 or parental control cells. (H) Western blot analysis of lamin B1 expression in parental control and HGPS cell strains shows similar levels of lamin B1 in both cell populations at the time of experimentation, underscoring the proliferating state of the HGPS cells at this point. (I,J) ChIP-qPCR evidence for K4me3 mesa formation in HGPS. Replicative senescence qPCR mesa validation shown in I (proliferating shown in orange and senescence shown in blue). The same K4me3 mesa analysis shown in J (parent control shown in purple and HGPS shown in green) indicates that K4me3 mesas may be a shared feature of HGPS. ChIP-qPCR primers are tiled across the region of the mesas and include 3′ and 5′ flanking primers. ChIP-qPCR data are shown as ratios of modification to total histone H3. ChIP-qPCR data are the average of three biological replicates, and error bars represent the standard deviation from the mean. (K,L) ChIP-qPCR test for K27me3 mesa formation in HGPS suggests that these features may not be forming in proliferating HGPS. Replicative senescence qPCR mesa validation shown in K (proliferating shown in orange and senescence shown in blue). The same K4me3 mesa analysis shown in L (parent control shown in purple and HGPS shown in green) indicates that K27me3 mesas may not be a shared feature of HGPS. Note that the K27me3 signal in HGPS is generally lower than the parental control, even at flanking regions. ChIP-qPCR primers are tiled across the region of the mesas and include 3′ and 5′ flanking primers. ChIP-qPCR data are shown as ratios of modification to total histone H3. ChIP-qPCR data are the average of three biological replicates, and error bars represent the standard deviation from the mean. (M,N) ChIP-qPCR test for K27me3 canyon formation in HGPS suggests that these features may not be forming in proliferating HGPS. Replicative senescence qPCR canyon validation shown in M (proliferating shown in orange and senescence shown in blue). The same K4me3 canyon analysis shown in N (parent control shown in purple and HGPS shown in green) indicates that K27me3 canyons are maybe not forming in still-proliferating HGPS cells. Note that the K27me3 signal in HGPS is generally lower than the parental control, even at flanking regions. ChIP-qPCR primers are tiled across the region of the canyons and include 3′ and 5′ flanking primers. ChIP-qPCR data are shown as ratios of modification to total histone H3. ChIP-qPCR data are the average of three biological replicates, and error bars represent the standard deviation from the mean.
Figure 4.
Figure 4.
Changes in H3K4me3 and H3K27me3 are correlated to gene expression changes in senescence. (A) Box plot representation of H3K4me3 (green) and H3K27me3 (pink) at the top 500 up-regulated and down-regulated genes in senescence shows loss of H3K4me3 at down-regulated genes and loss of H3K27me3 at up-regulated genes. Control genes (no change) are shown in gray boxes. Box plot on the right depicts the range of expression changes at the top 500 up-regulated and down-regulated genes. Enrichment is reported as a ratio of senescence/proliferating, and all ChIP-seq signal is normalized to total histone H3. (B) Scatter plot analysis of H3K4me3-mediated gene regulation in senescence; fold change H3K4me3 is shown on the Y-axis, and fold change gene expression is shown on the X-axis. Cell cycle genes are marked in green. The bottom left quadrant contains down-regulated genes that also lose H3K4me3. The boxed region in the bottom left quadrant is shown in the closeup on the right to highlight the enrichment of cell cycle genes for H3K4me3 loss. (C) Scatter plot analysis of H3K27me3-mediated gene regulation in senescence; the fold change H3K27me3 is shown on the Y-axis, and the fold change gene expression is shown on the X-axis. SASP genes are marked in red. The bottom right quadrant contains up-regulated genes that also lose H3K27me3. The boxed region in the bottom right quadrant is shown in the closeup on top to highlight the enrichment of SASP genes for H3K27me3 loss. (D) GO analysis of up-regulated genes that lose H3K27me3 shows a strong enrichment for genes that are involved in the senescence pathway, including senescence genes, anti-proliferation genes, and cell death/stress genes. Each GO category color indicates the level of significance (yellow to orange, as shown on the key in the bottom left). (E) Sample tracks of H3K4me3 and H3K27me3 ChIP-seq data over a down-regulated cell cycle gene, CCNA2 (Chr4: 122,955,000–122,966,500), show pronounced loss of H3K4me3 at the promoter and TSS of the gene. Proliferating tracks are shown in orange, senescence tracks are shown in blue, and H3K27me3 change is shown in gray. The gene location is shown on the bottom track. (F) Sample tracks of H3K4me3 and H3K27me3 ChIP-seq data over the up-regulated SASP gene TNFRSF10c (Chr8: 23,012,616–23,034,551) show pronounced loss of H3K27me3 across the gene. Proliferating tracks are shown in orange, senescence tracks are shown in blue, and H3K27me3 change is shown in gray. The gene location is shown on the bottom track.
Figure 5.
Figure 5.
Lamin B1 is significantly decreased in senescence, and LMNB1 knockdown in proliferating cells causes formation of canyons and mesas. (A, left panel) Western blot analysis of total lamin B1 in proliferating and senescent cells shows lamin B1 loss in senescent cells. Lysates were normalized by total cell count; GAPDH was used as a loading control. (Right panel) CTCF (boundary element), SA1 (cohesin component), and Lap2 are decreased in senescent lysates compared with proliferating cells. Lysates were normalized by total cell count with GAPDH as a loading control. (B) qRT–PCR measure of lamin B1 mRNA expression in knockdown compared with control. LMNB1 expression is reduced by >60% by two different shRNA constructs (shRNA 1 and shRNA 2) compared with scrambled hairpin and vector-only control infected cells. (C) Western blot analysis of total protein in LMNB1 knockdown compared with control. Total lamin B1 is significantly reduced at the protein level in two knockdowns (shRNA1 and shRNA 2) compared with scrambled hairpin and vector-only control infected cells. Lysates were normalized by total cell count with GAPDH used as a loading control. (D) Life span analysis of LMNB1 knockdown shows rapid senescence within two PDs following cell infection compared with controls. Life span is visualized by plotting PDs (Y-axis) to days of growth in culture (X-axis). Two life spans of wild-type (WT), uninfected IMR90 show senescence after 78 (red diamonds) and 81 (blue diamonds) PDs. EZH2 knockdown causes senescence after only two cell passages following infection (green and purple triangles). LMNB1 knockdown by two different shRNA constructs shows the same kinetics of rapid senescence as EZH2 (turquoise and orange circles). The rapid senescence kinetics are specific to EZH2 and LMNB1 knockdown, as empty vector-only and scrambled hairpin infections (blue and pink squares) have a nearly normal life span, although not as long as wild-type controls (red and blue diamonds). The flattening of the growth curves indicates the length of time that cells were kept in a senescent state prior to harvesting for further experimentation. (E) LMNB1 knockdown results in up-regulation of p16. qRT–PCR measure of p16 expression in LMNB1 knockdown cells compared with control shows expected senescence up-regulation of p16 following LMNB1 knockdown. Relative p16 expression is up-regulated in two knockdowns (shRNA1 and shRNA 2) compared with scrambled hairpin and vector-only control infected cells; GAPDH was used as a control. (F) LMNB1 and EZH2 knockdown causes cellular senescence, not cell death. EZH2 and LMNB1 knockdown does not cause significant cell death, as measured by annexin staining compared with empty vector control. EZH2 and LMNB1 knockdown cells undergo rapid senescence, within two PDs, as measured by SA-β-gal staining, compared with empty vector control. For both types of knockdown, stably infected cells were maintained in culture for 2–3 d to ensure growth cessation prior to experimentation. (G,H) Western blot analysis of lamin B1 expression (G) and histone H3 expression (H) in a time course of IMR90 cells approaching senescence. The PD60, PD70, and PD78 time points are all proliferating states compared with senescence at PD80. Lamin B1 levels appear to be decreasing in proliferating cells prior to achievement of senescence compared with GAPDH control (G), whereas histone H3 decrease does not appear to occur until cells are in a senescent state compared with GAPDH control (H). (I–K) ChIP-qPCR evidence for K4me3 mesa (Chr7: 61,558,937–64,197,991), K27me3 mesa (Chr6: 167,743,380–169,126,883), and K27me3 canyon (Chr2: 85,956,542–86,782,134) formation in LMNB1 knockdown (KD; regions defined in replicative senescence). Control knockdown data are shown in orange, and LMNB1 knockdown is shown in blue. ChIP-qPCR primers are tiled across the entire region of the mesas and canyon and include 3′ and 5′ flanking primers. ChIP-qPCR data are shown as ratios of modification to total histone H3. ChIP-qPCR data are the average of three biological replicates, and error bars represent standard deviation from the mean.

References

    1. Acosta JC, O'Loghlen A, Banito A, Guijarro MV, Augert A, Raguz S, Fumagalli M, Da Costa M, Brown C, Popov N, et al. 2008. Chemokine signaling via the CXCR2 receptor reinforces senescence. Cell 133: 1006–1018 - PubMed
    1. Adams PD 2009. Healing and hurting: Molecular mechanisms, functions, and pathologies of cellular senescence. Mol Cell 36: 2–14 - PubMed
    1. Baker DJ, Wijshake T, Tchkonia T, LeBrasseur NK, Childs BG, van de Sluis B, Kirkland JL, van Deursen JM 2011. Clearance of p16Ink4a-positive senescent cells delays ageing-associated disorders. Nature 479: 232–236 - PMC - PubMed
    1. Barascu A, Le Chalony C, Pennarun G, Genet D, Imam N, Lopez B, Bertrand P 2012. Oxidative stress induces an ATM-independent senescence pathway through p38 MAPK-mediated lamin B1 accumulation. EMBO J 31: 1080–1094 - PMC - PubMed
    1. Barski A, Cuddapah S, Cui K, Roh TY, Schones DE, Wang Z, Wei G, Chepelev I, Zhao K 2007. High-resolution profiling of histone methylations in the human genome. Cell 129: 823–837 - PubMed

Publication types

MeSH terms