. 2013 Oct;195(2):573-87.
doi: 10.1534/genetics.113.150078. Epub 2013 Aug 9.

Genome-wide prediction of traits with different genetic architecture through efficient variable selection

Affiliations

Genome-wide prediction of traits with different genetic architecture through efficient variable selection

Valentin Wimmer et al. Genetics. 2013 Oct.

Abstract

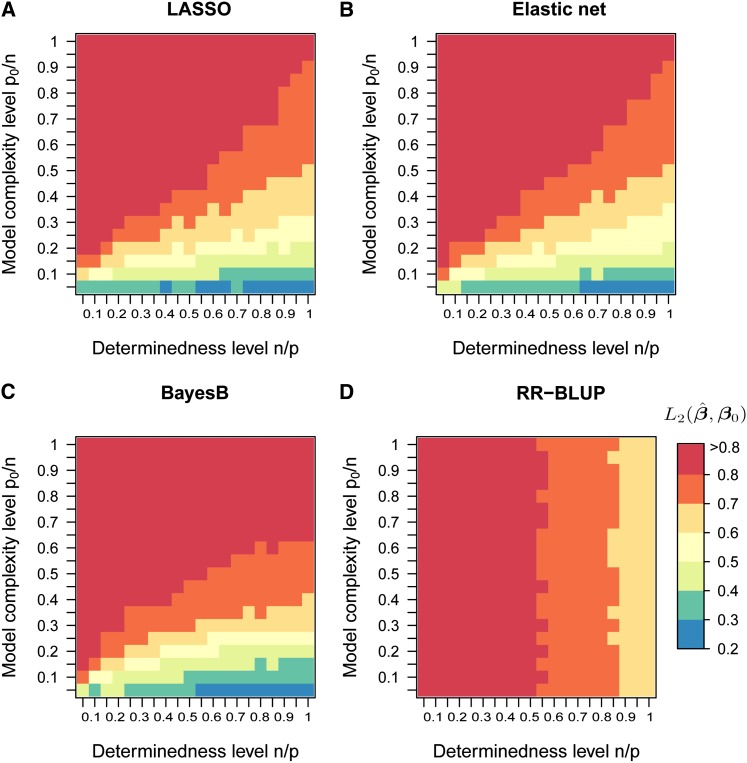
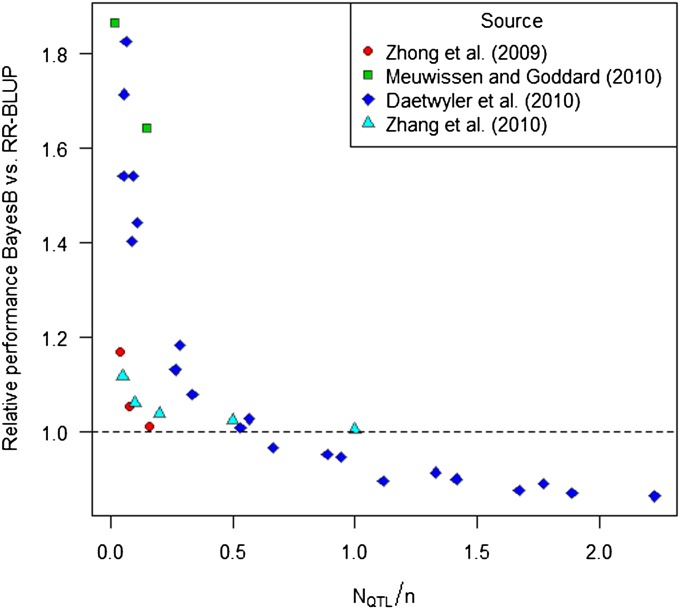
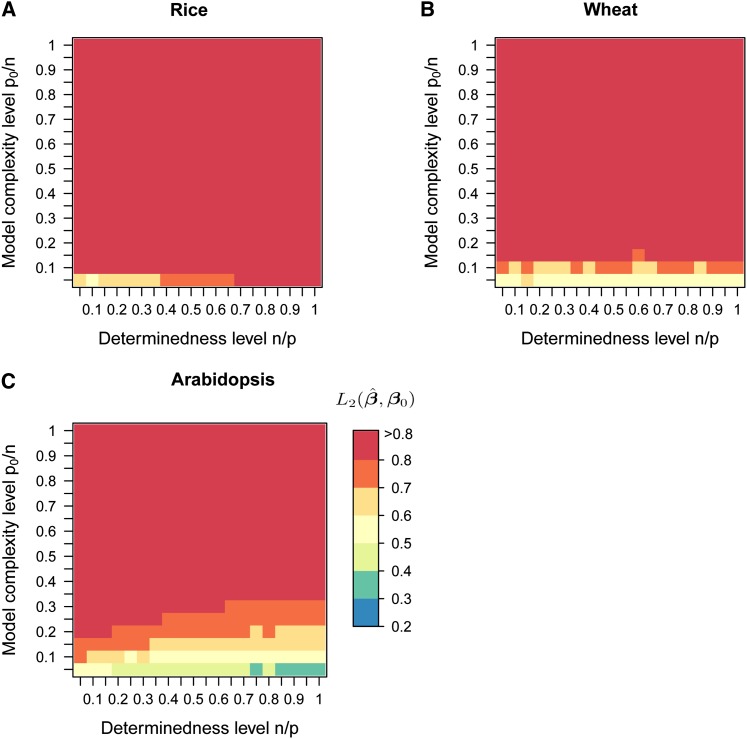
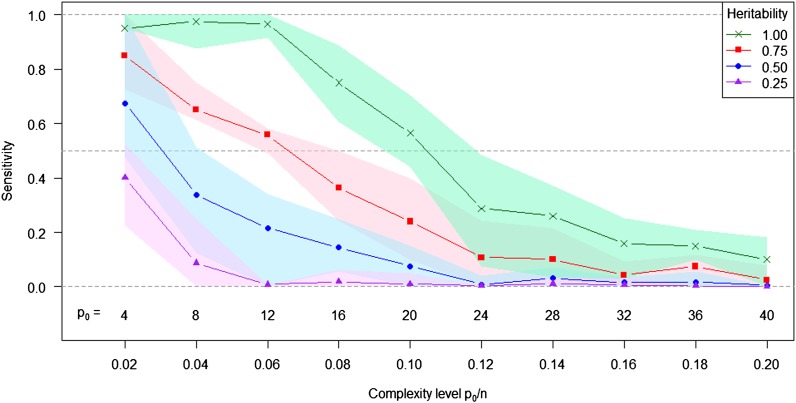
In genome-based prediction there is considerable uncertainty about the statistical model and method required to maximize prediction accuracy. For traits influenced by a small number of quantitative trait loci (QTL), predictions are expected to benefit from methods performing variable selection [e.g., BayesB or the least absolute shrinkage and selection operator (LASSO)] compared to methods distributing effects across the genome [ridge regression best linear unbiased prediction (RR-BLUP)]. We investigate the assumptions underlying successful variable selection by combining computer simulations with large-scale experimental data sets from rice (Oryza sativa L.), wheat (Triticum aestivum L.), and Arabidopsis thaliana (L.). We demonstrate that variable selection can be successful when the number of phenotyped individuals is much larger than the number of causal mutations contributing to the trait. We show that the sample size required for efficient variable selection increases dramatically with decreasing trait heritabilities and increasing extent of linkage disequilibrium (LD). We contrast and discuss contradictory results from simulation and experimental studies with respect to superiority of variable selection methods over RR-BLUP. Our results demonstrate that due to long-range LD, medium heritabilities, and small sample sizes, superiority of variable selection methods cannot be expected in plant breeding populations even for traits like FRIGIDA gene expression in Arabidopsis and flowering time in rice, assumed to be influenced by a few major QTL. We extend our conclusions to the analysis of whole-genome sequence data and infer upper bounds for the number of causal mutations which can be identified by LASSO. Our results have major impact on the choice of statistical method needed to make credible inferences about genetic architecture and prediction accuracy of complex traits.

Keywords: GenPred; complex traits; genetic architecture; genome-based prediction; plant breeding populations; shared data resources; variable selection.


Figures

Figure 1
Figure 1
(A–D) Accuracy of estimated marker effects in computer simulations using independent predictor variables. Simulations were conducted according to procedure 1 (Figure S6). In each scenario p = 2000 independent markers were simulated and h2 = 0.75 was used to simulate n phenotypic records. The normalized L2 errors of LASSO, the elastic net, BayesB, and RR-BLUP are displayed as heat maps for a grid of 20 values between 0.05 and 1.00 for the determinedness level n/p and model complexity level p0/n, respectively. The color key presents the normalized L2 error averaged over four replications for each scenario.
Figure 2
Figure 2
Averaged normalized L2 error vs. the averaged sensitivity of LASSO across all 400 scenarios with four replications as in Figure 1. The sensitivity was evaluated as the empirical conditional probability that one of the min(p0, 20) largest true nonzero coefficients was identified.
Figure 3
Figure 3
Normalized L2 error for LASSO, the elastic net, BayesB, and RR-BLUP as a function of the model complexity level. Curves were extracted from the surfaces in Figure 1 by fixing the determinedness level n/p at 0.05 and 0.50, respectively.
Figure 4
Figure 4
Normalized L2 error for LASSO, the elastic net, BayesB, and RR-BLUP as a function of the model complexity level for different trait heritabilities (h2 = 0.50 and 1.00) and n/p = 0.5. The simulations were conducted according to procedure 1 (Figure S6).
Figure 5
Figure 5
Meta-analysis of relative performance of BayesB compared to RR-BLUP with results from the literature. Results were extracted from the studies in Zhong et al. (2009), Daetwyler et al. (2010), Meuwissen and Goddard (2010), and Zhang et al. (2010), differing with respect to the number of QTL (NQTL) and sample size (n) of the training data set. Relative performance is defined as the ratio of accuracy or predictive ability of BayesB over RR-BLUP.
Figure 6
Figure 6
(A–C) Heat maps for the normalized L2 error of LASSO with correlated predictor variables. The correlation structure of the simulated marker data was superimposed from the three experimental data sets (rice, wheat, and Arabidopsis). The simulations were conducted according to procedure 3 (Figure S6). Each of the 400 scenarios (p = 2000 and h2 = 0.75) was repeated 10 times and results were averaged over replications.
Figure 7
Figure 7
Sensitivity of LASSO to identify true nonzero coefficients in simulated whole-genome sequence data. The lines indicate the average sensitivity over 10 replications, and the shaded area indicates the range between the 10% and 90% quantiles as a function of the model complexity level and trait heritability. The simulations were conducted according to procedure 1 (Figure S6) with the exception that n = 200 individuals and p = 250,000 markers were used. Heritabilities varied with h2 = 0.25, 0.50, 0.75, and 1.00.

References

    1. Albrecht T., Wimmer V., Auinger H.-J., Erbe M., Knaak C., et al. , 2011. Genome-based prediction of testcross values in maize. Theor. Appl. Genet. 123: 339–350. - PubMed
    1. Atwell S., Huang Y., Vilhjálmsson B., Willems G., Horton M., et al. , 2010. Genome-wide association study of 107 phenotypes in Arabidopsis thaliana inbred lines. Nature 465: 627–631. - PMC - PubMed
    1. Bates, D., and M. Maechler, 2012 Matrix: sparse and dense matrix classes and methods. R Package Version 1.0–6.
    1. Browning B. L., Browning S. R., 2009. A unified approach to genotype imputation and haplotype-phase inference for large data sets of trios and unrelated individuals. Am. J. Hum. Genet. 846: 210–223. - PMC - PubMed
    1. Butts C. T., 2008. Network: a package for managing relational data in R. J. Stat. Softw. 24: 1–36. - PubMed

Publication types