. 2013 Oct;22(10):1399-416.
doi: 10.1002/pro.2333.

An automated approach to network features of protein structure ensembles

Affiliations

An automated approach to network features of protein structure ensembles

Moitrayee Bhattacharyya et al. Protein Sci. 2013 Oct.

Abstract

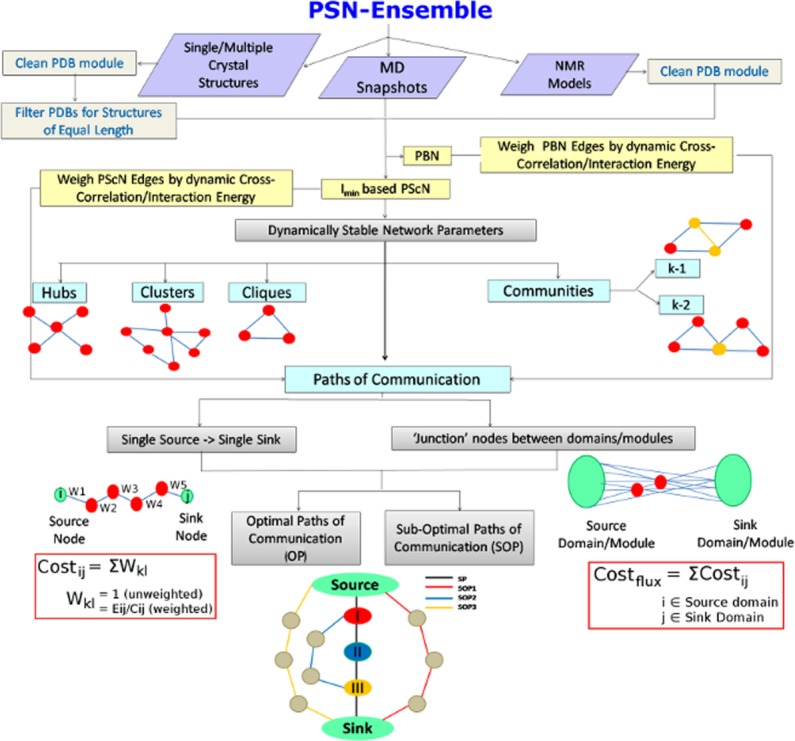
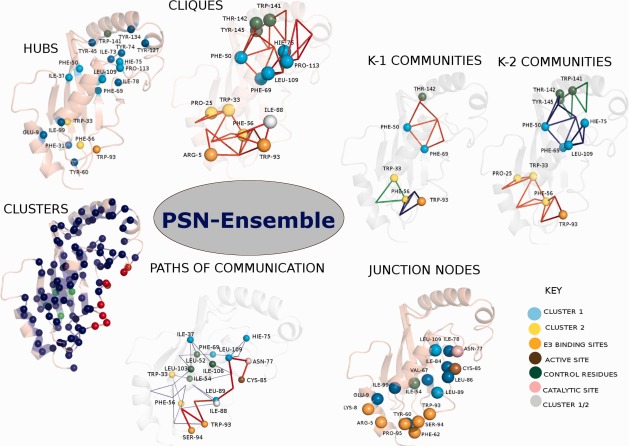
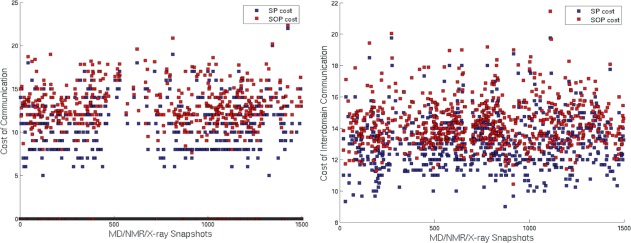
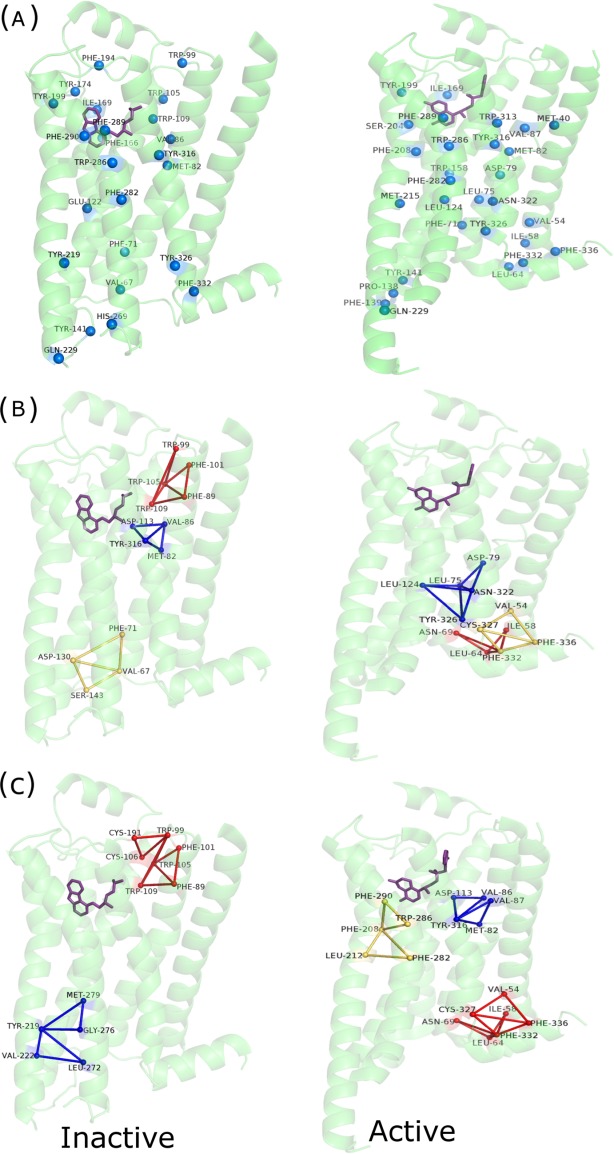
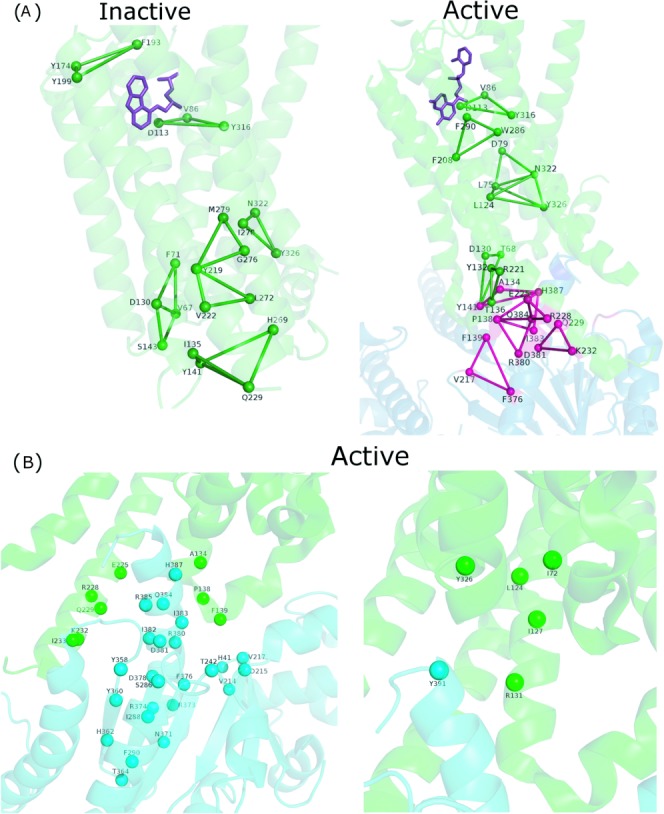
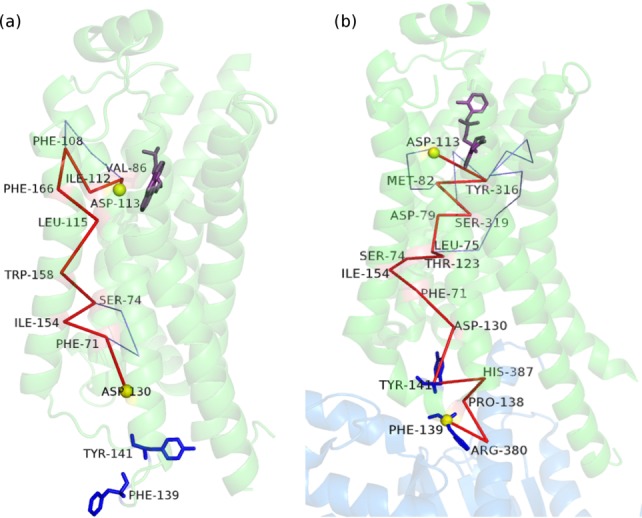
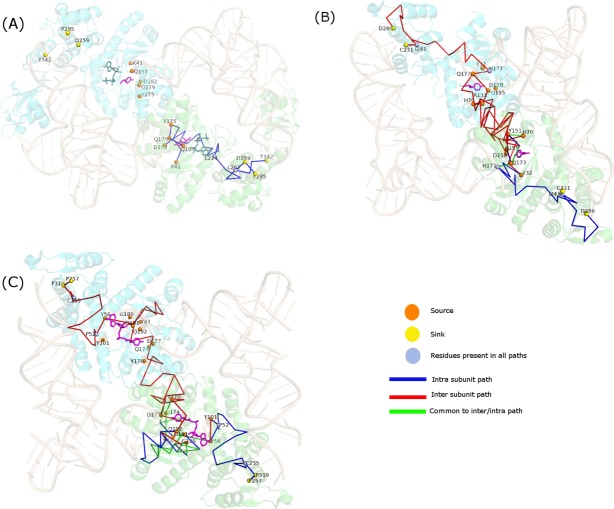
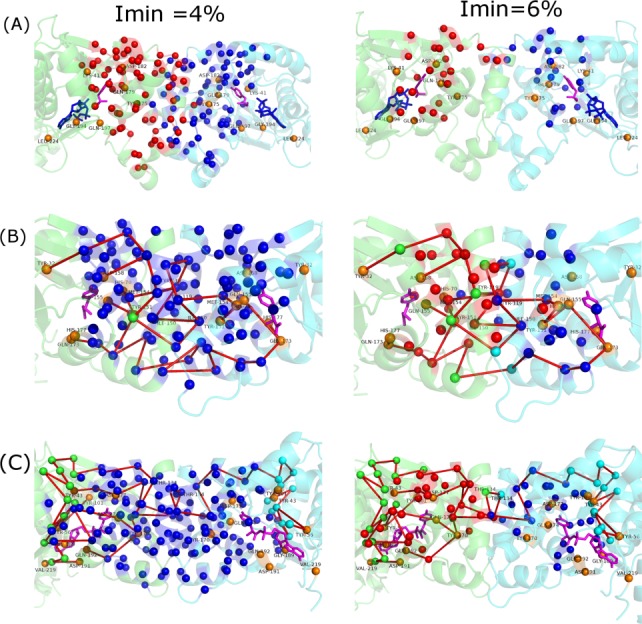
Network theory applied to protein structures provides insights into numerous problems of biological relevance. The explosion in structural data available from PDB and simulations establishes a need to introduce a standalone-efficient program that assembles network concepts/parameters under one hood in an automated manner. Herein, we discuss the development/application of an exhaustive, user-friendly, standalone program package named PSN-Ensemble, which can handle structural ensembles generated through molecular dynamics (MD) simulation/NMR studies or from multiple X-ray structures. The novelty in network construction lies in the explicit consideration of side-chain interactions among amino acids. The program evaluates network parameters dealing with topological organization and long-range allosteric communication. The introduction of a flexible weighing scheme in terms of residue pairwise cross-correlation/interaction energy in PSN-Ensemble brings in dynamical/chemical knowledge into the network representation. Also, the results are mapped on a graphical display of the structure, allowing an easy access of network analysis to a general biological community. The potential of PSN-Ensemble toward examining structural ensemble is exemplified using MD trajectories of an ubiquitin-conjugating enzyme (UbcH5b). Furthermore, insights derived from network parameters evaluated using PSN-Ensemble for single-static structures of active/inactive states of β2-adrenergic receptor and the ternary tRNA complexes of tyrosyl tRNA synthetases (from organisms across kingdoms) are discussed. PSN-Ensemble is freely available from http://vishgraph.mbu.iisc.ernet.in/PSN-Ensemble/psn_index.html.

Keywords: MD/NMR ensemble; PSN-Ensemble program; UbcH5b; beta2-adrenergic receptor; network features; protein structure network; tRNA synthetases; weighted network.


Figures

Figure 1
Figure 1
A flowchart representing the workflow in PSN-Ensemble. The package is compatible with crystal structure (single or multiple structures), MD simulation, and NMR ensemble structures. Various network parameters for characterizing the topological organization in proteins [hubs, clusters, cliques, communities (k-1/k-2)] can be obtained at a given Imin (see Methods section) from PScN. The network parameters to characterize long-range communication in terms of paths and cost of communication [OPs and SOPs] can be calculated based on PScN or PBN. A schematic description of each of the network parameters is also included in the flowchart for easy comprehension. [Color figure can be viewed in the online issue, which is available at wileyonlinelibrary.com.]
Figure 2
Figure 2
Pictorial representation of the various network parameters [hubs, clusters, cliques, communities (k-1/k-2), OPs and SOPs, junction nodes] for an MD ensemble of UbcH5b (PDB_id: 2ESK) using PSN-Ensemble at an Imin of 2%. The protein is represented as a cartoon and the residues identified from various network parameters are shown as van der Waals spheres. The top three communities (blue, red, and green) and the OP (red) and top six SOPs (blue) are plotted. The important residues identified from the previous studies are color coded as explained in the figure. Paths of communication (OPs/SOPs) are obtained by choosing Ser94 (E3 binding site) and Cys85 (active site) as the source and sink, respectively. “Junction nodes” are obtained between the source domain comprising of residues Ser94, Pro95, Phe62, Tyr60, Arg5, Lys8 and sink domain comprising of Cys85 (active site) and Asn77 (catalytic site).
Figure 3
Figure 3
Plots for (a) cost of communication between single source (Ser94)—single sink (Cys85) residues. The SOP cost is averaged over all the SOPs for a given snapshot. (b) Average cost of communication between source domain (Ser94, Pro95, Phe62, Tyr60, Arg5 [E3 binding domain] and sink domain (Cys85 [active site] and Asn77 [catalytic site]). A distinct pattern is evident in the profile for the cost of communication between residues suggesting probable conformational changes at regular intervals. Such a pattern is not evident from the RMSD profile which is relatively flat (data not shown). [Color figure can be viewed in the online issue, which is available at wileyonlinelibrary.com.]
Figure 4
Figure 4
Pictorial depiction of (a) hubs, (b) communities [k-1], and (c) communities [k-2] for the inactive and active forms of β2-AR. The protein backbone is depicted in green cartoon representation. Only the β2-AR is depicted for ease of comparison. The hub residues are depicted as van der Waals spheres and the communities (top three) are depicted using blue, red, and yellow lines, respectively. A residuewise comparison of these results with key residues predicted in earlier studies are summarized in Supporting Information Table S5. [Color figure can be viewed in the online issue, which is available at wileyonlinelibrary.com.]
Figure 5
Figure 5
Pictorial depiction of (a) core and interface cliques constituted by key residues (Supporting Information Table S5) for the inactive and active forms and (b) clusters at the interface between the receptor and Gαs for the active form of β2-AR. The β2-AR and Gαs backbones are depicted in green and blue/cyan cartoon representation, respectively. The interface cluster residues are depicted as van der Waals spheres and the cliques are depicted using dark green (core) and dark pink (interface) lines, respectively. The Gs protein coupling interface is beautifully captured by these interface network parameters. [Color figure can be viewed in the online issue, which is available at wileyonlinelibrary.com.]
Figure 6
Figure 6
Pictorial depiction of the paths of communication (OP/SOPs) from D133 in the ligand binding pocket to F139 at the Gs protein coupling interface for the (a) inactive and (b) active states of β2-AR. The path is blocked due to lack of appropriate interactions in the inactive state. Binding of Gs protein and agonist in the active state appears to re-establish this path of communication/signaling. The β2-AR and Gαs backbones are depicted in green and blue cartoon representation, respectively. The OP is shown in red and the SOPs are shown in blue lines. The source and the sink residues are highlighted as yellow van der Waals' spheres. The key F139 and Y141 residues and the ligand (inverse agonist/agonist) are shown in blue and violet stick representation, respectively. [Color figure can be viewed in the online issue, which is available at wileyonlinelibrary.com.]
Figure 7
Figure 7
Pictorial depiction of paths of communication between source and sink residues of TyrRS from (a) Thermus thermophilus (bacteria), (b) Methanococcus janachsii (archea), and (c) Saccharomyces cerevisiae (yeast). TyrRS backbone is shown in cartoon representation in green (subunit A) and cyan (subunit B) and tRNA molecules are depicted as cartoons in wheat color. Tyrosine and ATP molecules are shown in stick representation in pink and steel green, respectively. The source/sink residues and the residues common to all paths are depicted as van der Waals spheres in orange/yellow and blue, respectively. Intra subunit, inter subunit and those common to both intra and inter subunit pathways are depicted as lines in blue, red, and green, respectively. As evident, inter subunit communication exists in archeal and yeast TyrRS, while it is absent in its bacterial counterpart. [Color figure can be viewed in the online issue, which is available at wileyonlinelibrary.com.]
Figure 8
Figure 8
Pictorial representation of interface clusters in TyrRS from (a) Thermus thermophilus (bacteria), (b) Methanococcus janachsii (archea), and (c) Saccharomyces cerevisiae (yeast) at Imin of 4% and 6%. TyrRS backbone is shown in cartoon representation in green (subunit A) and cyan (subunit B). Tyrosine and ATP molecules are shown in stick representation in pink and blue, respectively. The interface cluster residues are depicted as van der Waals spheres in blue and red. Source residues and residues not part of the interface cluster (which are present in paths between active sites in the two subunits) are depicted as van der Waals spheres in orange and green (in subunit A)/cyan (subunit B), respectively. The intra subunit paths between the active sites are shown in red. Presence of a single large interface cluster at 4% and two distinct interface clusters spanning the interface at 6% ensures effective communication between the two subunits in archeal and yeast TyrRS which is absent in bacterial TyrRS. [Color figure can be viewed in the online issue, which is available at wileyonlinelibrary.com.]

References

    1. Newman M. The structure and function of complex networks. SIAM Rev. 2003;45:167–256.
    1. Newman M, Barabasi A-L, Watts DJ. The structure and dynamics of networks. Princeton University Press; 2006.
    1. Vishveshwara S, Brinda KV, Kannan N. Protein structure: insights from graph theory. J Theor Comput Chem. 2002;1:187–211.
    1. Atilgan AR, Atilgan C. Local motifs in proteins combine to generate global functional moves. Brief Funct Genomics. 2012;11:479–488. - PubMed
    1. Greene LH, Higman VA. Uncovering network systems within protein structures. J Mol Biol. 2003;334:781–791. - PubMed

Publication types

MeSH terms

LinkOut - more resources