. 2013 Sep;136(Pt 9):2799-815.
doi: 10.1093/brain/awt216. Epub 2013 Aug 8.

Biological sex affects the neurobiology of autism

Collaborators, Affiliations

Biological sex affects the neurobiology of autism

Meng-Chuan Lai et al. Brain. 2013 Sep.

Abstract

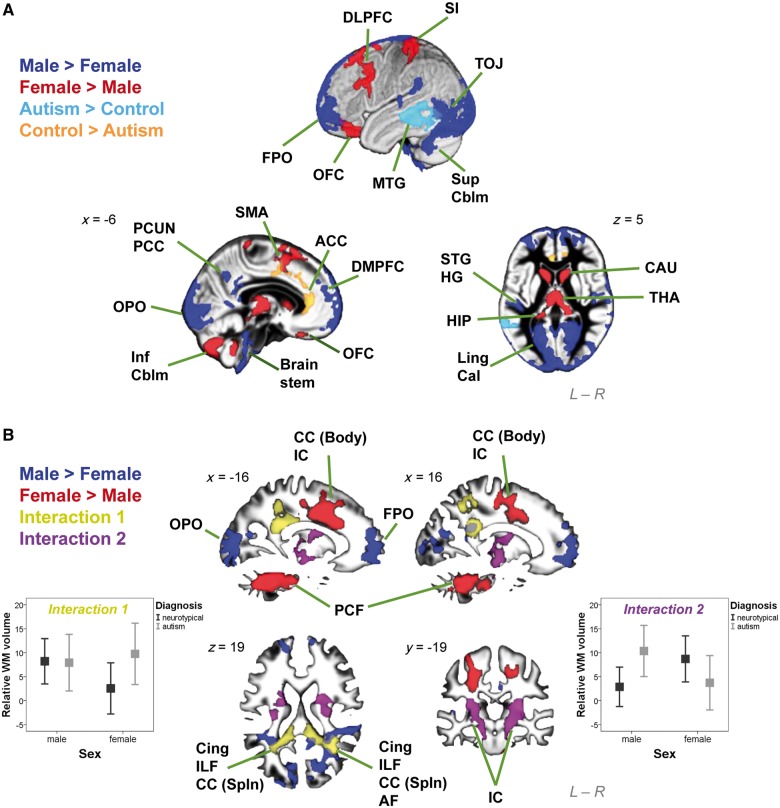
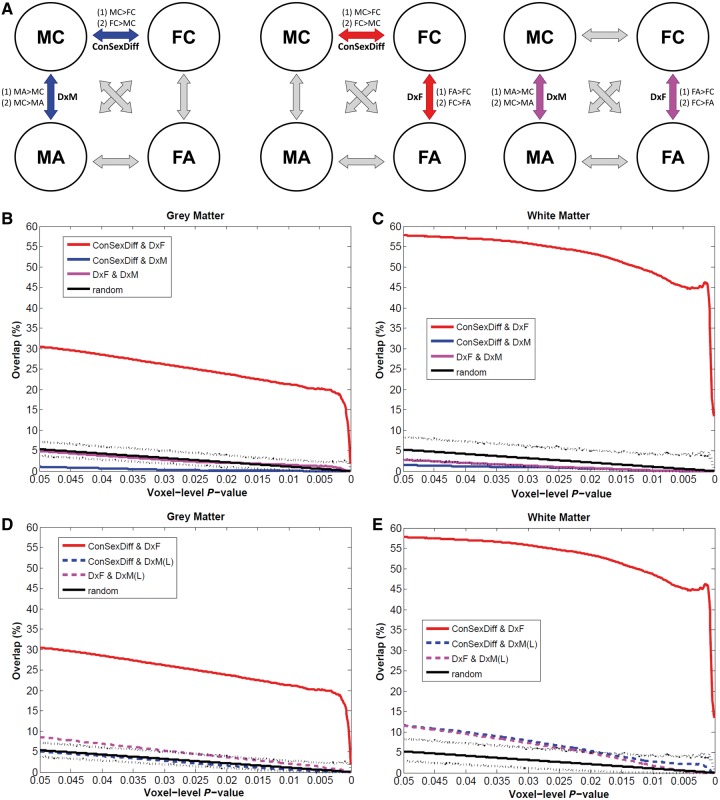
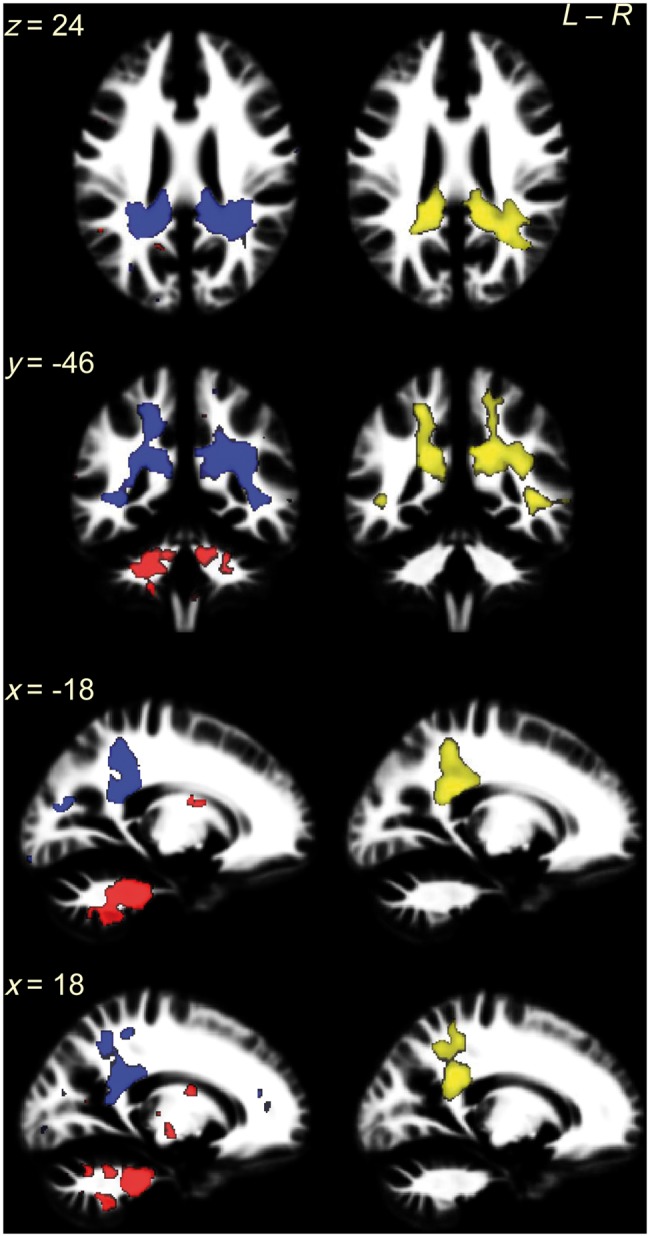
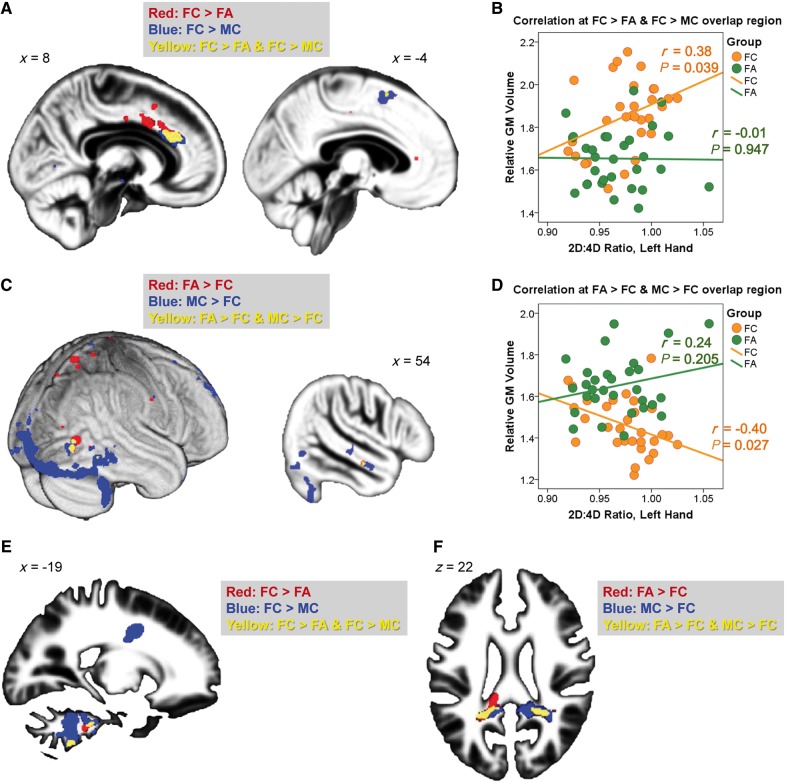
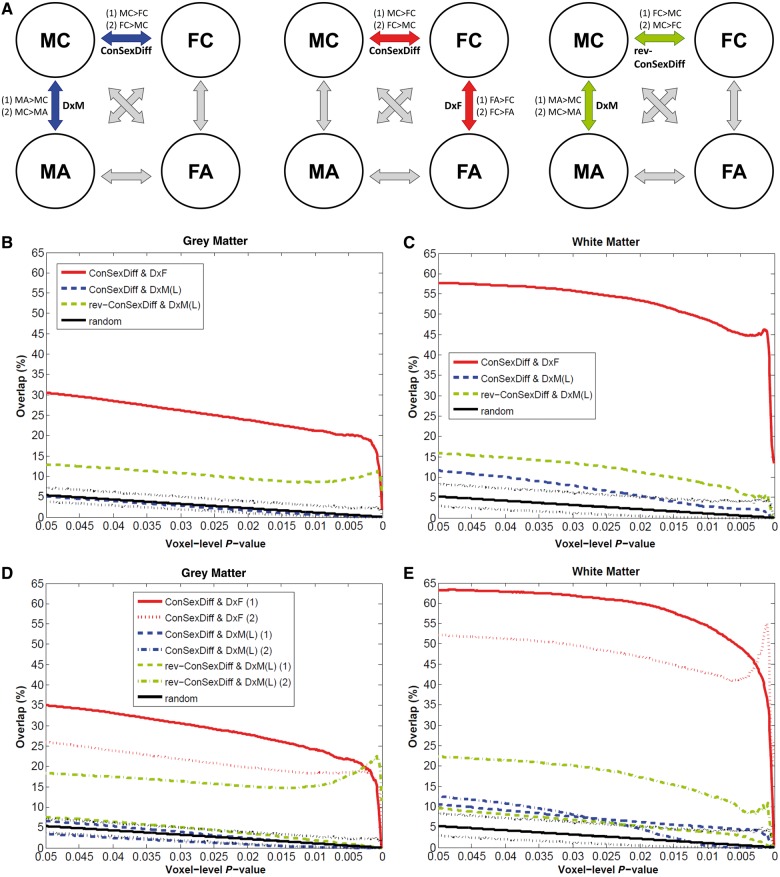
In autism, heterogeneity is the rule rather than the exception. One obvious source of heterogeneity is biological sex. Since autism was first recognized, males with autism have disproportionately skewed research. Females with autism have thus been relatively overlooked, and have generally been assumed to have the same underlying neurobiology as males with autism. Growing evidence, however, suggests that this is an oversimplification that risks obscuring the biological base of autism. This study seeks to answer two questions about how autism is modulated by biological sex at the level of the brain: (i) is the neuroanatomy of autism different in males and females? and (ii) does the neuroanatomy of autism fit predictions from the 'extreme male brain' theory of autism, in males and/or in females? Neuroanatomical features derived from voxel-based morphometry were compared in a sample of equal-sized high-functioning male and female adults with and without autism (n = 120, n = 30/group). The first question was investigated using a 2 × 2 factorial design, and by spatial overlap analyses of the neuroanatomy of autism in males and females. The second question was tested through spatial overlap analyses of specific patterns predicted by the extreme male brain theory. We found that the neuroanatomy of autism differed between adult males and females, evidenced by minimal spatial overlap (not different from that occurred under random condition) in both grey and white matter, and substantially large white matter regions showing significant sex × diagnosis interactions in the 2 × 2 factorial design. These suggest that autism manifests differently by biological sex. Furthermore, atypical brain areas in females with autism substantially and non-randomly (P < 0.001) overlapped with areas that were sexually dimorphic in neurotypical controls, in both grey and white matter, suggesting neural 'masculinization'. This was not seen in males with autism. How differences in neuroanatomy relate to the similarities in cognition between males and females with autism remains to be understood. Future research should stratify by biological sex to reduce heterogeneity and to provide greater insight into the neurobiology of autism.

Keywords: autism; brain; sex differences; volumetric MRI.


Figures

Figure 1
Figure 1
Brain structures showing significant interaction and main effects in the 2 x 2 factorial design VBM. (A) Clusters were overlaid on the grey matter segment of the study-specific template. Substantially large clusters where males are larger than females are in dark blue, females larger than males in red, neurotypical controls larger than autism groups in orange, and autism groups larger than neurotypical controls in light blue. (B) Clusters were overlaid on the white matter segment of the study-specific template. Substantially large clusters where males are larger than females are in dark blue, and females larger than males in red. Importantly, large clusters with significant sex × diagnosis interactions were noted. A pattern of FA > FC but MA = MC (left error-bar graph; y-axis indicates relative white matter volume [arbitrary unit] and error bar indicates standard error of the mean) was identified in two clusters (yellow), and a pattern of MA > MC but FA < FC (right error-bar graph) in two clusters (purple). ACC = anterior cingulate cortex; AF = arcuate fasciculus; Cal = calcarine; CAU = caudate; CC (Body) = body of corpus callosum; CC (Spln) = splenium of corpus callosum; Cing = cingulum; DLPFC = dorsolateral prefrontal cortex; DMPFC = dorsomedial prefrontal cortex; FPO = frontal pole; HG = Heschl gyrus; HIP = hippocampus; IC = internal capsule; ILF = inferior longitudinal fasciculus; Inf Cblm = inferior cerebellum; Ling = lingual gyrus; MTG = middle temporal gyrus; OFC = orbitofrontal cortex; OPO = occipital pole; PCC = posterior cingulate cortex; PCF = ponto-cerebellar fibres; PCUN = precuneus; SI = primary somatosensory cortex; SMA = supplementary motor area; STG = superior temporal gyrus; Sup Cblm = superior cerebellum; THA = thalamus; TOJ = temporo-occipital junction.
Figure 2
Figure 2
Testing brain-level predictions of the EMB theory of autism. (A) The three repeated diagrams illustrate the analytic strategy, measuring spatial overlap between VBM comparisons (double arrows) between two of the four groups (circles). Whether there is a substantial overlap between MC–FC (‘ConSexDiff’) and MC–MA (‘DxM’) tests the EMB theory prediction in males (left diagram, blue arrows, two spatial overlap analyses for two pairs of contrasts [(1) and (2)], each using two VBM group-difference maps); whether there is a substantial overlap between MC–FC and FC–FA (‘DxF’) tests the EMB theory prediction in females (middle diagram, red arrows). Additionally, comparing MC–MA and FC–FA indicates how similar the neuroanatomical features of autism are in males and in females (right diagram, purple arrows). (B and C) Spatial overlaps of VBM group-difference maps are shown along voxel-level thresholds from P = 0.05 down to P = 0.0001 for grey matter (B) and white matter (C). Red lines indicate the percentage of voxels characterizing diagnostic effect of autism in females (DxF) that also belong to those characterizing sex differences in controls (ConSexDiff), averaged from both directions of contrasts. Blue lines indicate the same for males using the main sample (DxM). Purple lines represent the overlap between voxels characterizing autism in females and that in males (DxF & DxM). Black solid lines indicate the average overlap occurred under random conditions derived from 5000 Monte Carlo simulations, with dotted lines indicating the 0.5 and 99.5 percentiles. Red lines constantly show high values irrespective of the voxel-level threshold, whereas all others are markedly lower and are below or within the random range. (D and E) These repeat panels B and C, but using the MA–MC group-difference maps derived from the larger multicentre male sample (n = 84/group). Red lines (overlap in females) and black lines (random condition) are exactly the same as those in B and C. Blue and purple dashed lines indicate the same analyses but using the larger male sample [DxM(L)]. These replicate the findings from the main sample.
Figure 3
Figure 3
White matter overlapping regions in females coincide with clusters showing a significant sex × diagnosis interaction in the 2 × 2 factorial design. The left column shows the white matter overlapping voxels for ‘FC > FA AND FC > MC’ contrasts (red) and ‘FA > FC AND MC > FC’ contrasts (blue) from voxel-level P < 0.025 maps. The majority of them were spatially contiguous and constituted bilateral clusters: the former (red) involved ponto-cerebellar fibres and the latter (blue) involved cingulum, corpus callosum (splenium), inferior longitudinal fasciculus and arcuate fasciculus. Particularly, the latter located at the same regions as clusters showing a sex × diagnosis interaction in the 2 × 2 factorial design VBM (right column, yellow; thresholded at voxel-level P < 0.025 and corrected for multiple comparisons by ensuring a cluster-wise topological FDR at q < 0.05). This replication in location of the overlap (blue, from analysis to Question 2) and sex × diagnosis interaction (yellow, from analysis to Question 1) illustrates the fact that the linkage between neuroanatomical features of autism and features of typical sexual dimorphism is specific to females, because this linkage is statistically significantly different from that in males, who lack such a linkage.
Figure 4
Figure 4
Overlapping region and 2D:4D ratio. (A–D) Overlapping grey matter regions (yellow, from voxel-level P < 0.0005 maps) linking neuroanatomical features of autism in females (FC–FA) to those of sex differences in control subjects (MC–FC) were spatially contiguous and showed a volumetric correlation to left-hand 2D:4D ratio in neurotypical females but not females with autism, for both directions of contrasts [A: overlap at right anterior cingulate cortex (left) and a smaller cluster at left supplementary motor area (right); B: the correlations for regions in A; C: overlap at right extrastriate visual cortex (left) and middle temporal gyrus (right); D: the correlations for regions in C]. These regions reflect neuroanatomical features of autism in females, show typical sex differences, and have volumetric correlations to prenatal sex hormonal processes only in neurotypical females, possibly because their volumes in females with autism were already close to the limits for females in general, evidenced by the convergence of the regression lines of the two groups under strongest prenatal androgen effects (i.e. lowest 2D:4D ratio). (E and F) Overlapping white matter regions were spatially contiguous and involved the ponto-cerebellar fibres (E) and posterior corpus callosum, cingulum, inferior longitudinal fasciculus and arcuate fasciculus (F). They failed to show a volumetric correlation with 2D:4D ratio. GM = grey matter.
Figure 5
Figure 5
Overlap analyses testing whether males with autism are ‘feminized’ in terms of neuroanatomy. Following Fig. 2, this figure additionally illustrates whether males with autism show neuroanatomical features that resemble typical sex differences but in a direction indicative of ‘feminization’ (A, right). Green lines indicate the percentage of voxels characterizing the diagnostic effect of autism in males [DxM(L), using the larger multicentre male sample] that also belong to those characterizing ‘feminization’ (rev-ConSexDiff), averaged from both directions of contrasts in panels B and C, but separately in panels D and E (E shares the same legend as D). In panels B and C, red and blue lines exactly repeat those in Fig. 2D and 2E. In panels D and E, for each overlap analysis results from the two directions of pair of contrasts are separately shown.

References

    1. American Psychiatric Association. Diagnostic and Statistical Manual of Mental Disorders. 4th edn text revision (DSM-IV-TR) Washington, DC: American Psychiatric Publishing, Inc.; 2000.
    1. Ashburner J. A fast diffeomorphic image registration algorithm. Neuroimage. 2007;38:95–113. - PubMed
    1. Ashburner J, Friston KJ. Voxel-based morphometry—the methods. Neuroimage. 2000;11(6 Pt 1):805–21. - PubMed
    1. Asperger H. ‘Autistic psychopathy’ in childhood. In: Frith U, editor. Autism and Asperger syndrome. Cambridge, UK: Cambridge University Press; 1944/1991. pp. 37–92.
    1. Attwood T. Asperger’s and girls. Arlington, TX: Future Horisons, Inc.; 2006. The pattern of abilities and development of girls with Asperger’s syndrome.

Publication types