. 2013 Jul;11(7):e1001616.
doi: 10.1371/journal.pbio.1001616. Epub 2013 Jul 30.

Mapping differentiation under mixed culture conditions reveals a tunable continuum of T cell fates

Affiliations

Mapping differentiation under mixed culture conditions reveals a tunable continuum of T cell fates

Yaron E Antebi et al. PLoS Biol. 2013 Jul.

Abstract

Cell differentiation is typically directed by external signals that drive opposing regulatory pathways. Studying differentiation under polarizing conditions, with only one input signal provided, is limited in its ability to resolve the logic of interactions between opposing pathways. Dissection of this logic can be facilitated by mapping the system's response to mixtures of input signals, which are expected to occur in vivo, where cells are simultaneously exposed to various signals with potentially opposing effects. Here, we systematically map the response of naïve T cells to mixtures of signals driving differentiation into the Th1 and Th2 lineages. We characterize cell state at the single cell level by measuring levels of the two lineage-specific transcription factors (T-bet and GATA3) and two lineage characteristic cytokines (IFN-γ and IL-4) that are driven by these transcription regulators. We find a continuum of mixed phenotypes in which individual cells co-express the two lineage-specific master regulators at levels that gradually depend on levels of the two input signals. Using mathematical modeling we show that such tunable mixed phenotype arises if autoregulatory positive feedback loops in the gene network regulating this process are gradual and dominant over cross-pathway inhibition. We also find that expression of the lineage-specific cytokines follows two independent stochastic processes that are biased by expression levels of the master regulators. Thus, cytokine expression is highly heterogeneous under mixed conditions, with subpopulations of cells expressing only IFN-γ, only IL-4, both cytokines, or neither. The fraction of cells in each of these subpopulations changes gradually with input conditions, reproducing the continuous internal state at the cell population level. These results suggest a differentiation scheme in which cells reflect uncertainty through a continuously tuneable mixed phenotype combined with a biased stochastic decision rather than a binary phenotype with a deterministic decision.


Conflict of interest statement

The authors have declared that no competing interests exist.

Figures

Figure 1
Figure 1. Understanding the logic of cell fate decisions by studying response to a matrix of input combinations at the single cell level.
(A) A schematic representation of cell differentiation through a binary cell fate decision. Signal A drives differentiation of a precursor cell into the differentiated state X. Signal B drives it into the state Y. Cell decision is mediated by a GRN that typically involves interacting signaling pathways that contain various positive and negative feedback loops. (B) Mutual exclusion model: The GRN has two stable states, each corresponding to the phenotype of a specific differentiated lineage. (C) Multiple states model: In a range of input conditions cells are found in a third state, co-expressing characteristic genes of both lineages. (D) Continuous transition model: As the input conditions vary, a single steady state continuously shifts between the two extreme phenotypes, giving rise to a continuum of differentiated cell states with mixed characteristics. (E) Single cell variability: Under mixed input conditions, the cell population can be either heterogeneous, with each cell in either the X or Y “pure state” (i), or in a “mixed state,” with cells co-expressing lineage-specific factors (ii). Note that under polarizing input conditions (top-left and bottom-right corners), all models are indistinguishable.
Figure 2
Figure 2. Input function for Th1/Th2 cell differentiation under mixed input conditions reveals a tunable mixed phenotype.
(A) Histograms of T-bet levels measured in populations of cells cultured with decreasing levels of IL-4 and increasing levels of IL-12 (yellow to blue color). Dashed curve, cells from a T-bet knockout mouse. (B) Histograms of GATA3 levels measured in populations of cells cultured with increasing levels of IL-4 and a constant level of IL-12 (yellow to blue color). Dashed curve, GATA3 isotype control staining. (C, D) Measured median fluorescence intensities (MFI) for T-bet (C) and GATA3 (D), in response to a matrix of orthogonal gradients of the two input signals IL-12 and IL-4. Regions 1 and 2 represent standard polarizing conditions used to generate a Th1 or Th2 response, respectively. Region m represents a state with mixed inputs, resulting in expression of both T-bet and GATA3. (E–G) Scatter plots showing normalized measured expression patterns of T-bet and GATA3, under the conditions marked by 1,m,2 in panels (C, D) (see Text S1 for details). A single, unimodal population is observed, which shifts in the T-bet-GATA3 plane in response to input signals. Colored dots in each panel show the population median. (H) Distributions of the parameter α, representing the ratio between expression levels of T-bet and GATA3 (see F and definition in the main text), for cell populations cultured under Th1, Th2, and mixed input conditions. The distributions all show a single peak, and continuously shift from a Th1 (α≈90°) to a Th2 state (α≈0°). (I) Representative images of cells cultured under various input conditions as indicated, fixed and stained for T-bet (blue, pseudo-color) and GATA3 (red, pseudo-color). Images were acquired using fluorescent flow microscopy (see Materials and Methods). Three cells for each condition are shown in the bright-field (BF), T-bet, and GATA3 channels. (J) The input function of T-bet is well described by separation of variables, with each input influencing the output in an independent manner. Shown are the calculated dependencies of T-bet on the two inputs, F1(IL-12) and F2(IL-4), and the calculated input function given by F1(IL-12)×F2(IL-4), which shows a high similarity with the measured data (C). See Figure S3 for similar results for GATA3, IFN-γ, and IL-4.
Figure 3
Figure 3. A model for a continuously tunable mixed-state under mixed input conditions.
(A) A schematic model for the effective GRN module regulating Th1–Th2 differentiation. (B) Analysis of the model for gradual feedback links (n = 1). The number and location of fixed points for given input signals depend on the ratio between the strength of negative and positive feedbacks, formula image 
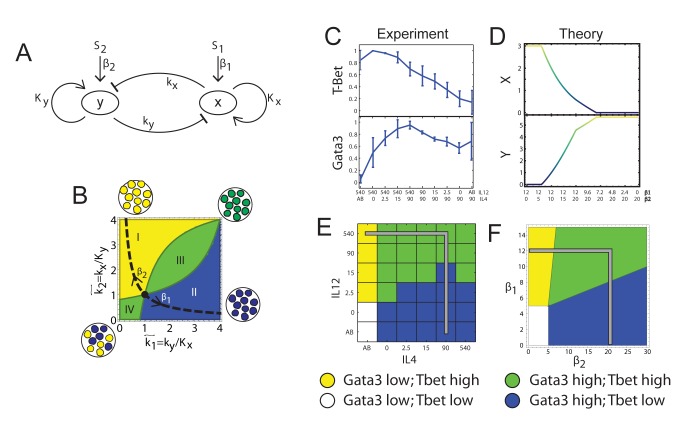
(see Text S1 for details). In region I, the GRN has a single fixed point with a high level of x and a low level of y. In region II it has a single fixed point with low x and high y. In region III it has a single fixed point with co-expression of both TFs, whereas in region IV it has two stable fixed points (bifurcation). (C–D) TF levels shift continuously upon gradual changes in input signal mixtures. Measured levels (MFI) of T-bet and GATA3 (C) along a trajectory in input plane, which interpolates between a Th1 and a Th2 condition (shown in E, gray line). Continuous changes in TF levels are in agreement with model predictions for n = 1, region III (D) and do not show any bi-stability or sharp transitions as predicted by a high-n model, or low-n model region IV. (E–F) Mapping patterns of TF co-expression over the entire input plane, comparing experiment (E) and model (F). For each TF, we define a threshold level T at ∼50% of its maximal expression level. Regions' color represents patterns of co-expression, as shown in the legend.
Figure 4
Figure 4. Mapping input function of cytokine expression reveals a highly heterogeneous population under mixed input conditions.
(A) Histograms of IFN-γ secretion levels measured in a population of cells cultured with decreasing levels of IL-4 and increasing levels of IL-12 (bright to dark colour). Dashed curve, isotype control. (B) Histograms of IL-4 secretion levels measured in a population of cells cultured with increasing levels of IL-4 and a constant level of IL-12 (yellow to blue colour). Dashed curve, isotype control. (C, D) Measured MFI for IFN-γ (C) and IL-4 (D), in response to a matrix of orthogonal gradients of the two input signals IL-12 and IL-4. Regions 1, 2, and m are the same as in Figure 2C,D. (E–G) Scatter plots showing normalized measured expression patterns of IFN-γ and IL-4. Under mixed conditions cell population is highly heterogeneous in cytokine expression, with subpopulations expressing only IFN-γ (+/−), only IL-4 (−/+), both cytokines (+/+), and neither one (−/−). (H) Distributions of the parameter α′, representing the ratio between expression levels of IFN-γ and IL-4 (see definition in the main text) for cell populations cultured under Th1, Th2, and mixed input conditions. As for the TFs, the distributions under Th1 and Th2 conditions show a single peak. However, in contrast with TF, under mixed input conditions the distribution is broad and covers the whole range of values between α′ = 90° (Th2) and α′ = 0° (Th1).
Figure 5
Figure 5. Heterogeneity in cytokine expression is generated through independent and biased stochastic processes.
(A, B) Probability of cytokine expression is biased by the level of the corresponding TF. Cells growing under Th1, Mixed, and Th2 conditions were binned according to their measured level of (A) T-bet or (B) GATA3 expression. For each bin, containing 500 cells, the fraction of cells expressing (A) IFN-γ or (B) IL-4 is plotted versus the mean TF level of cells in that bin. The red line shows the population average level of the TF, and the green line shows the fraction of cytokine positive cells in the entire cell population. (C) GATA3/T-bet ratio is plotted for the four subpopulations of cytokine expression in cells growing under mixed conditions, compared with this ratio measured in cells cultured under polarizing Th1 or Th2 conditions. All four subpopulations of cells that were cultured under mixed conditions show a similar T-bet/GATA3 ratio, irrespective of their cytokine secretion state (−/−, +/−, −/+, +/+: corresponding to the four quadrants of Figure 4E). This observation is insensitive to the threshold values used to define the subpopulations (Figure S9). (D) Cells were cultured under mixed conditions for 1 wk, and then viably sorted into four subpopulations according to their cytokine expression pattern, as indicated (subpopulations correspond to the four quadrants of Figure 4E). Each subpopulation was re-cultured under mixed conditions for another week, restimulated, and levels of cytokine expression were measured, as shown. Within that week all subpopulations were able to re-populate all four quadrants, such that all cytokine expression patterns reappear.
Figure 6
Figure 6. A two-stage scheme for continuously tunable Th1–Th2 differentiation.
The two input signals (top) drive the GRN that controls differentiation of CD4+ T cells. The levels of the two lineage-specifying transcription factors, T-bet and GATA3, tune (bar graphs) from a Th1 state (left) to a Th2 state (right), through a continuum of intermediate states in which both factors are co-expressed. Cytokine expression upon restimulation is stochastic. The fraction of cells that express IFN-γ or IL-4 is biased by the levels of the corresponding transcription factors, as well as by other factors (dashed arrows). These two stochastic processes are independent. This model results in a heterogonous cell population (scatter plots, right), with cells expressing only IFN-γ (yellow ellipse), only IL-4 (blue), both cytokines (green), or neither (white). The fraction of cells in each of the four subpopulations continuously tunes with changing inputs. Expression levels of all four factors are represented schematically by the cell populations at the bottom. The internal color represents levels of T-bet and GATA3 tuning from Th1 (yellow, T-bet high, GATA3 low) to Th2 (blue, T-bet low, GATA3 high), through intermediate levels of green. The outer color represents cytokine expression upon restimulation, showing a higher level of heterogeneity. For clarity, we don't show here noise in gene expression (for example, cells cultured under Th1 conditions express different levels of T-bet, and similarly for the other proteins and conditions). Note that other factors influence this differentiation process (TCR stimulation strength and duration, other cytokines), which we assume here to be constant across all conditions.

References

    1. Tam PPL, Loebel D a F (2007) Gene function in mouse embryogenesis: get set for gastrulation. Nature Reviews Genetics 8: 368–381 Available at http://www.ncbi.nlm.nih.gov/pubmed/17387317. Accessed 6 March 2013. - PubMed
    1. Kattman SJ, Witty AD, Gagliardi M, Dubois NC, Niapour M, et al. (2011) Stage-specific optimization of activin/nodal and BMP signaling promotes cardiac differentiation of mouse and human pluripotent stem cell lines. Cell Stem Cell 8: 228–240 Available at http://www.ncbi.nlm.nih.gov/pubmed/21295278. Accessed 6 March 2013. - PubMed
    1. Zhou JX, Huang S (2011) Understanding gene circuits at cell-fate branch points for rational cell reprogramming. Trends in Genetics: TIG 27: 55–62 Available at http://www.ncbi.nlm.nih.gov/pubmed/21146896. Accessed 27 February 2013. - PubMed
    1. Cantor AB, Orkin SH (2001) Hematopoietic development: a balancing act. Current Opinion in Genetics & Development 11: 513–519 Available at http://www.ncbi.nlm.nih.gov/pubmed/11532392. Accessed 6 December 2011. - PubMed
    1. Mariani L, Löhning M, Radbruch A, Höfer T (2004) Transcriptional control networks of cell differentiation: insights from helper T lymphocytes. Progress in Biophysics and Molecular Biology 86: 45–76 Available at http://www.ncbi.nlm.nih.gov/pubmed/15261525. - PubMed

Publication types