

Spatial stochastic dynamics enable robust cell polarization
- PMID: 23935469
- PMCID: PMC3723497
- DOI: 10.1371/journal.pcbi.1003139
Spatial stochastic dynamics enable robust cell polarization
Abstract
Although cell polarity is an essential feature of living cells, it is far from being well-understood. Using a combination of computational modeling and biological experiments we closely examine an important prototype of cell polarity: the pheromone-induced formation of the yeast polarisome. Focusing on the role of noise and spatial heterogeneity, we develop and investigate two mechanistic spatial models of polarisome formation, one deterministic and the other stochastic, and compare the contrasting predictions of these two models against experimental phenotypes of wild-type and mutant cells. We find that the stochastic model can more robustly reproduce two fundamental characteristics observed in wild-type cells: a highly polarized phenotype via a mechanism that we refer to as spatial stochastic amplification, and the ability of the polarisome to track a moving pheromone input. Moreover, we find that only the stochastic model can simultaneously reproduce these characteristics of the wild-type phenotype and the multi-polarisome phenotype of a deletion mutant of the scaffolding protein Spa2. Significantly, our analysis also demonstrates that higher levels of stochastic noise results in increased robustness of polarization to parameter variation. Furthermore, our work suggests a novel role for a polarisome protein in the stabilization of actin cables. These findings elucidate the intricate role of spatial stochastic effects in cell polarity, giving support to a cellular model where noise and spatial heterogeneity combine to achieve robust biological function.
Conflict of interest statement
The authors have declared that no competing interests exist.
Figures
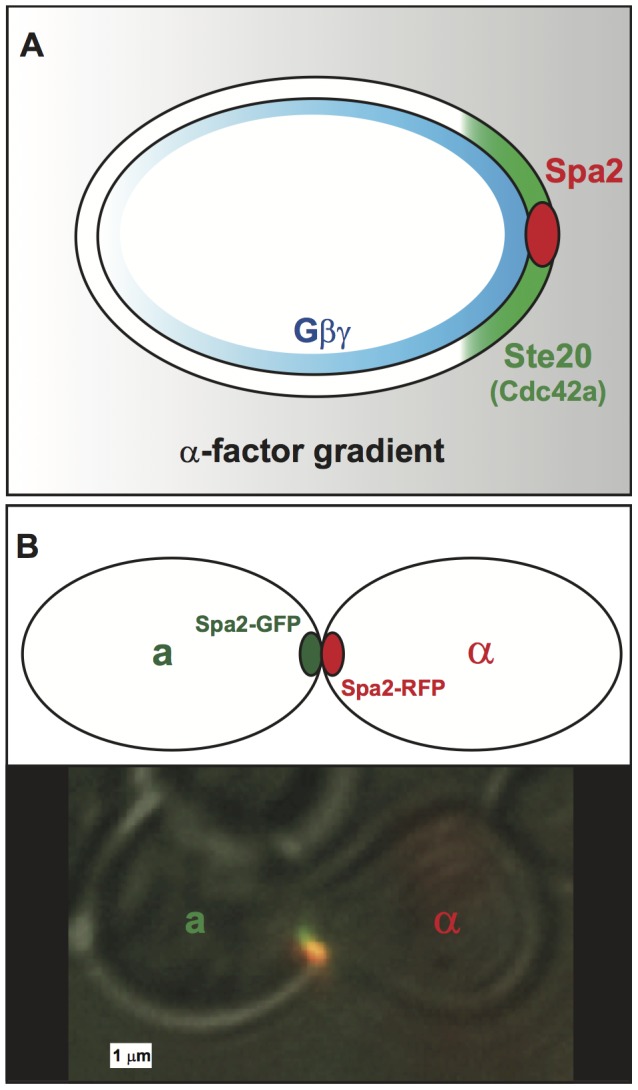
 -factor is shallow (gray), and it generates a comparable gradient of free
  on the cell membrane. This initial internal gradient induces a polarized cap of active Cdc42 (green) which in turn localizes the tightly condensed polarisome (red) to the front of the cell. In this manner, a shallow external gradient is amplified to a steep internal gradient. (B) A schematic and microscopy image of two mating yeast cells with aligned punctate polarisomes. The polarisomes are labeled with Spa2-GFP (a-cell) and Spa2-RFP (
 -cell). During mating the polarisomes at the tip of the mating projection are tightly localized and seek out one another until they are aligned and adjacent. When the projections meet the membranes and polarisomes fuse, and mating occurs.

 (left) and
  (right). There is no change with
  , while for
  as
as  goes to zero the curves approach the theoretical no-diffusion limit (dashed black). Also see video S2. (C) Left: Cartoon illustrating the Bni1 temperature sensitive mutant experiment performed in and simulated in this paper. Right: Phase plane of actin cable half-life (color-coded) as a function of
  and
and  (simulation of the experiment in [41]), with the curve representing 45 s (dotted black) and our model fit (dashed black). This phase plane represents the average of those generated for initial conditions corresponding to 10 different observed cells.
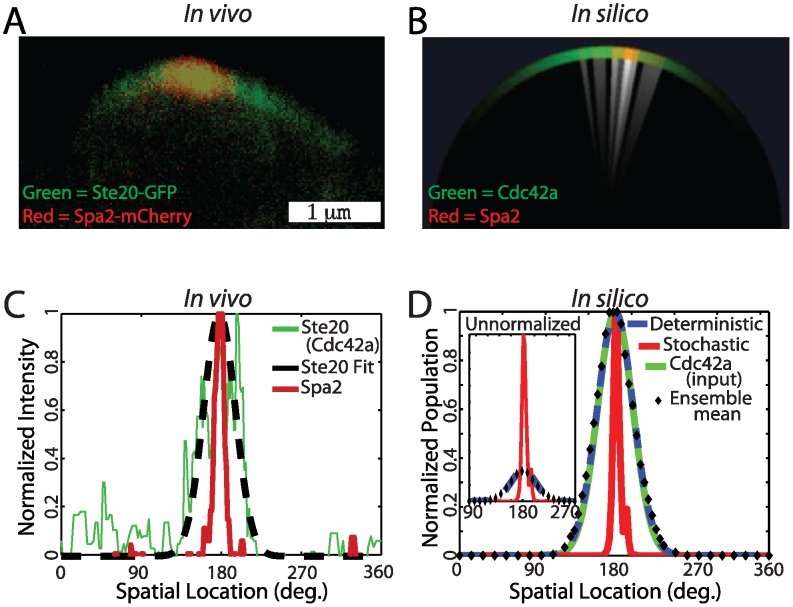
 -factor show the wider Cdc42a (marked by Ste20-GFP) and tighter Spa2 polarization. (B) Visualization of a stochastic realization of the polarisome model (white indicates regions with actin cables attached to the membrane). (C) Normalized fluorescence intensity membrane profiles of Ste20-GFP and Spa2-mCherry from a yeast cell undergoing polarisome formation (Green: Ste20 (Cdc42a). Dashed black: Ste20 fit. Red: Spa2). Ensemble mean experimental data is in Fig. S19. (D) Normalized membrane intensity profile from stochastic and deterministic realizations of polarisome model, the Cdc42a input, and the mean output of a stochastic ensemble (
 ). Inset: Absolute membrane intensity profile from stochastic and deterministic realizations of polarisome model, and Spa2 ensemble mean. (Red: Spa2 Stochastic. Dashed blue: Spa2 deterministic. Black diamond: Spa2 ensemble mean. Green: Cdc42a (input)).
 minute overlap time when two polarisomes are present. Also see videos S3 and S4.
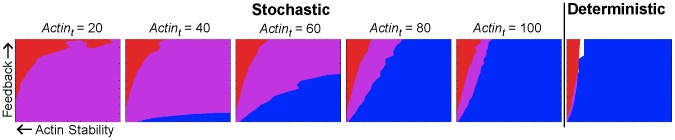
 values of 20, 40, 60, 80, 100 (left to right); the final panel shows results from the deterministic model.
  values (x-axis) range from 0 to 4000,
  /
/ ratio (y-axis) ranges from 0 to 10. Blue indicates accurate tracking (>70% probability), red indicates narrow width (
 FWHM), purple indicates that both criteria are met and white indicates that neither criterion is met. As the number of actin cables is increased, the stochastic phenotype plots converge to the deterministic plot. Lower actin cable number confers a larger region where both criteria are satisfied, indicating that increased stochasticity leads to more robustness to parameter variation. For each plot, the
  parameter was adjusted to maintain a constant flux of Spa2 to the membrane.
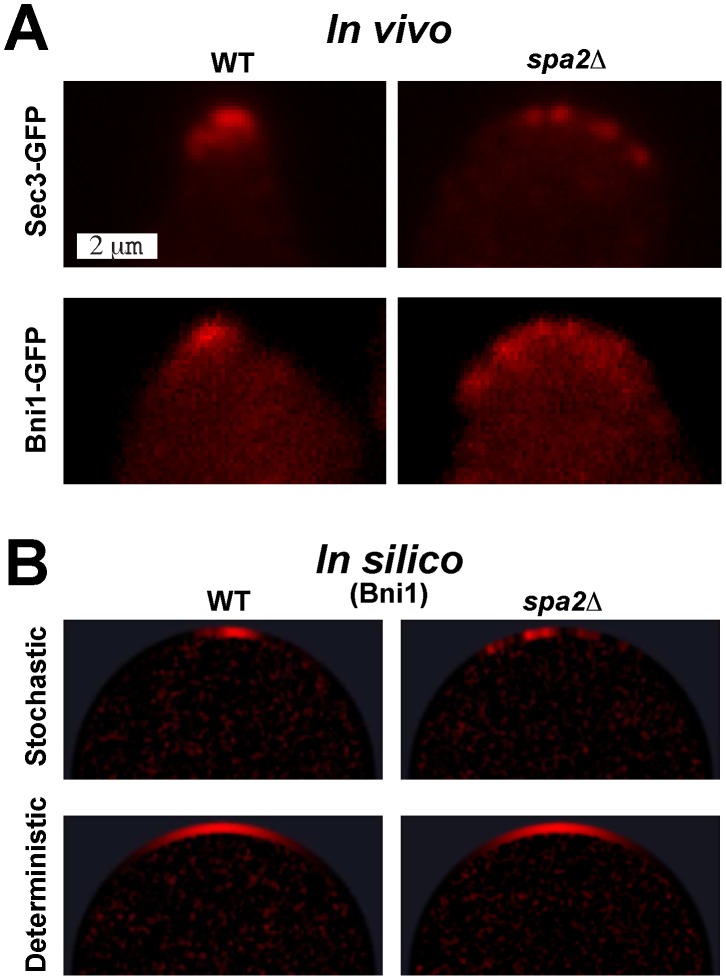
 phenotype (right). (A) In vivo microscopy images of polarizing yeast cells marked with Sec3-GFP (top row) and Bni1-GFP (bottom row). Note the difference between the single punctuate polarisome (left) and the multi-polarisome phenotype (right). Also see video S5. (B) In silico snapshots of yeast polarisome simulations for both stochastic (top row) and deterministic (bottom row) models showing Bni1. Note that only the stochastic in silico model is able to match the in vivo multi-polarisome phenotype. Also see video S6.
References
-
- Drubin DG, Nelson WJ (1996) Origins of cell polarity. Cell 84: 335–344. - PubMed
-
- Wedlich-Soldner R, Li R (2003) Spontaneous cell polarization: undermining determinism. Nat Cell Biol 5: 267–270. - PubMed
-
- Arkowitz RA (2001) Cell polarity: Connecting to the cortex. Curr Biol 11: R610–R612. - PubMed
-
- Dohlman HG, Thorner J (2001) Regulation of G protein-initiated signal transduction in yeast: Paradigms and principles. Annual Review of Biochemistry 70: 703–754. - PubMed
-
- Pruyne D, Bretscher A (2000) Polarization of cell growth in yeast: I. Establishment and maintenance of polarity states. J Cell Sci 113: 365–375. - PubMed
Publication types
MeSH terms
Grants and funding
LinkOut - more resources
Full Text Sources
Other Literature Sources
Molecular Biology Databases
Miscellaneous
