. 2013;9(7):e1003663.
doi: 10.1371/journal.pgen.1003663. Epub 2013 Jul 25.

A moonlighting enzyme links Escherichia coli cell size with central metabolism

Affiliations

A moonlighting enzyme links Escherichia coli cell size with central metabolism

Norbert S Hill et al. PLoS Genet. 2013.

Abstract

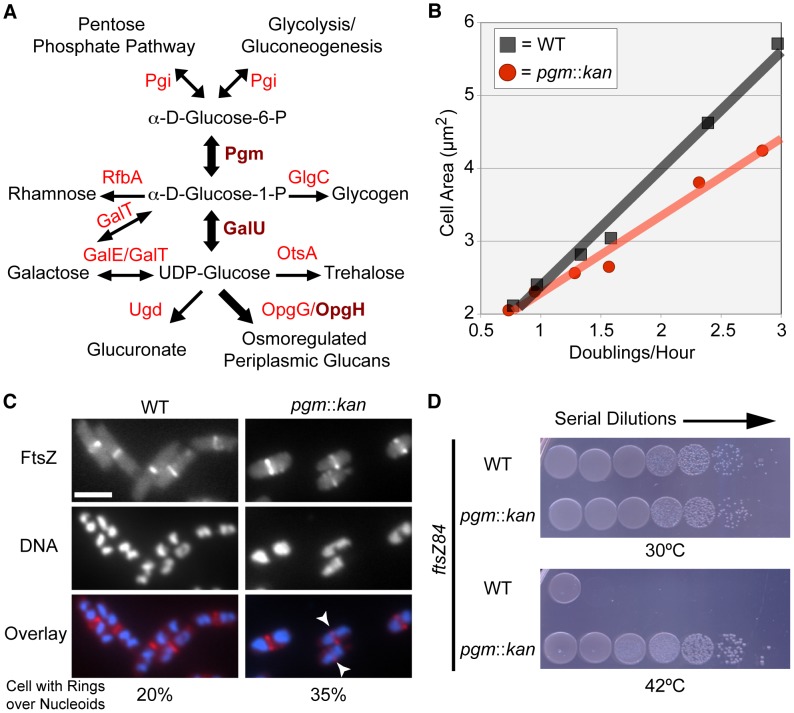
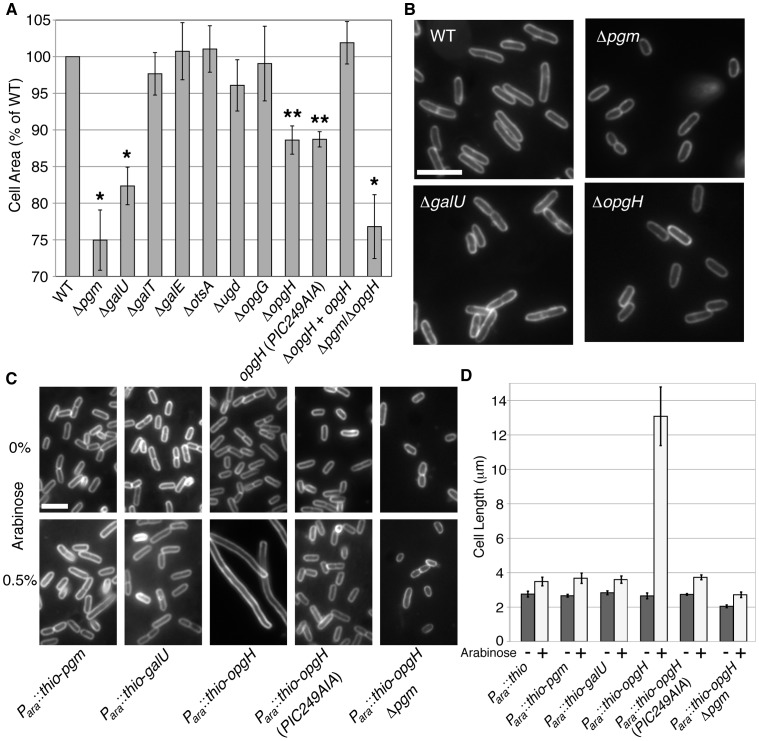
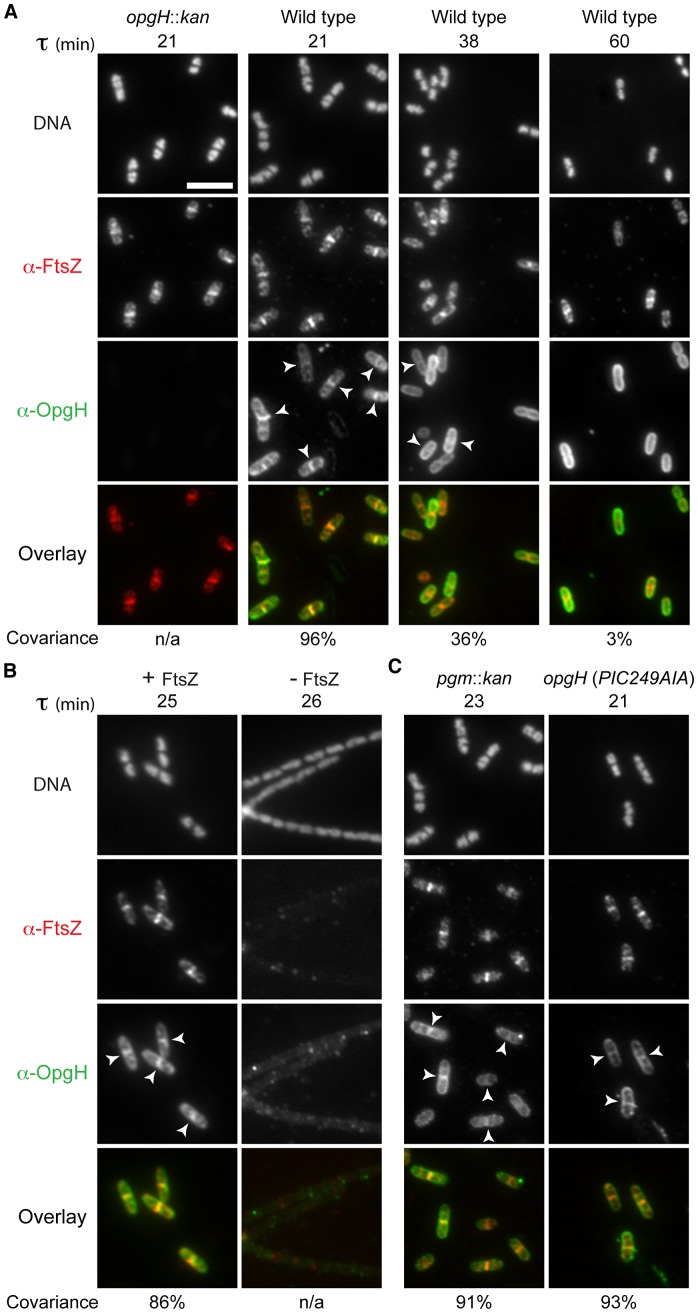
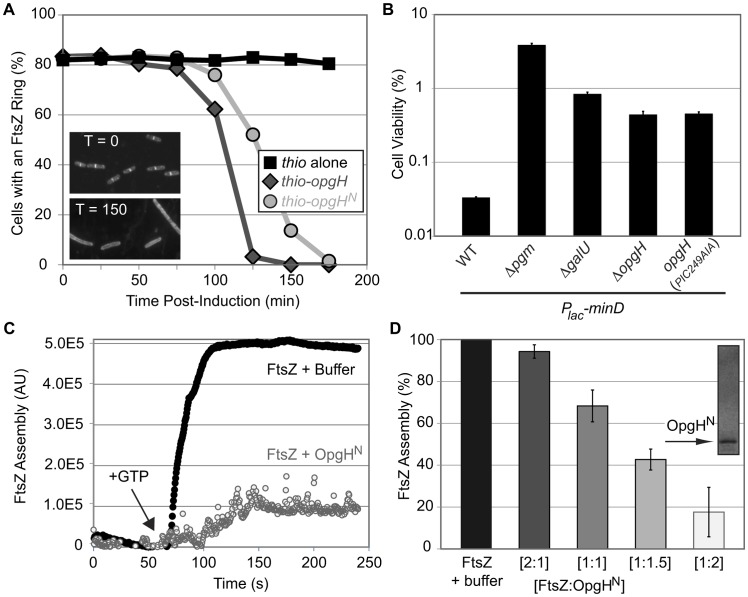
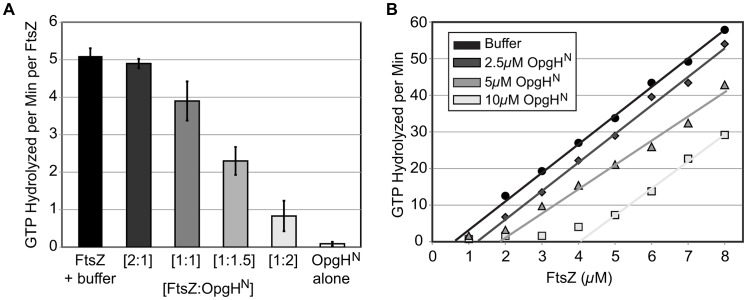
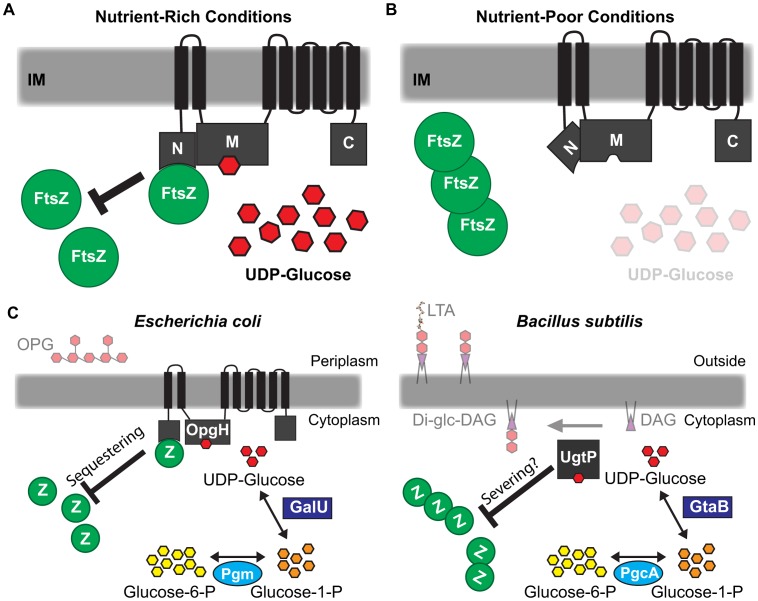
Growth rate and nutrient availability are the primary determinants of size in single-celled organisms: rapidly growing Escherichia coli cells are more than twice as large as their slow growing counterparts. Here we report the identification of the glucosyltransferase OpgH as a nutrient-dependent regulator of E. coli cell size. During growth under nutrient-rich conditions, OpgH localizes to the nascent septal site, where it antagonizes assembly of the tubulin-like cell division protein FtsZ, delaying division and increasing cell size. Biochemical analysis is consistent with OpgH sequestering FtsZ from growing polymers. OpgH is functionally analogous to UgtP, a Bacillus subtilis glucosyltransferase that inhibits cell division in a growth rate-dependent fashion. In a striking example of convergent evolution, OpgH and UgtP share no homology, have distinct enzymatic activities, and appear to inhibit FtsZ assembly through different mechanisms. Comparative analysis of E. coli and B. subtilis reveals conserved aspects of growth rate regulation and cell size control that are likely to be broadly applicable. These include the conservation of uridine diphosphate glucose as a proxy for nutrient status and the use of moonlighting enzymes to couple growth rate-dependent phenomena to central metabolism.


Conflict of interest statement

The authors have declared that no competing interests exist.

Figures

Figure 1
Figure 1. E. coli utilizes UDP-glucose to coordinate nutrient availability with cell size.
(A) A simplified schematic of UDP-glucose production and utilization in E. coli. Substrates are in black font, enzymes are in red font. Enzymes crucial to coordination of size with growth rate are in dark red and bold. Metabolic pathway information was derived from the Kyoto Encyclopedia of Genes and Genomes (KEGG) website , . (B) Cell area measurements of wild type (black squares) versus pgm::kan (red circles) in various growth media (from left to right: AB-succinate, AB-glucose, AB-succinate + casamino acids (CAA), AB-glucose + CAA, LB, and LB-glucose). (C) Occurrence of FtsZ rings over incompletely segregated nucleoids in wild type or smaller pgm::kan cells. Both strains encode a chromosomal copy of Plac::gfp-ftsZ and were cultured in nutrient-rich conditions (LB-glucose with 1 mM IPTG). GFP-FtsZ (top), DAPI stained DNA (middle), and the overlay with FtsZ in red and DNA in blue (bottom). White arrows indicate cells with a division ring over partially segregated chromosomes. Bar = 2.5 µm. (See Table S1 for expanded analysis.) (D) Disrupting UDP-glucose production by disrupting pgm suppresses lethality of FtsZ84 in non-permissive conditions (42°C). Serial dilution plating of strains with ftsZ84 ± pgm::kan grown on nutrient-rich, low-salt media at 30°C (permissive) or 42°C (restrictive). See also Figure S1 (expression levels of FtsZ84).
Figure 2
Figure 2. OpgH acts as a nutrient-dependent division antagonist.
(A) Cell area measurements of mutants in UDP-glucose synthesis or utilization cultured in LB-glucose. WT is set to 100%. >250 cells were measured per sample, error bars are standard deviation (n>3). The opgH null is complemented with a plasmid encoding Plac::opgH-gfp and was cultured with 0.08 mM IPTG. This fusion is shown to be functional for glucosyltransferase ability (Figure S5). * denotes p>0.001, ** signifies p>0.05 as judged by chi2 analysis. (B) Micrographs of WT and knockouts of genes involved in UDP-glucose pathway grown in LB-glucose and stained with the membrane dye FM4-64. Bar = 5 µm. (C) Representative micrographs and (D) cell length measurements of strains cultured in LB overexpressing genes in the UDP-glucose pathway from an arabinose inducible promoter. Uninduced cells are on the upper panel. Induced constructs are on the bottom panel. Cells are stained with FM4-64. Bar = 5 µm. Error bar denotes standard deviation (n = 3). See also Table S2 (information of length, width, and growth rate), Figure S3 (measurements of cells defective in factors adjacent to the UDP-glucose biosynthesis pathway), and Figure S4 (Thio-OpgH-His overexpression levels).
Figure 3
Figure 3. OpgH localizes to midcell in a growth rate- and FtsZ-dependent manner.
Immunofluorescence localization of FtsZ and OpgH in various growth conditions or genetic backgrounds. (A) OpgH localizes at midcell with FtsZ only at fast growth rates. Wild type cells were grown in either LB-glucose (τ = 21′), AB-glucose + casamino acids (τ = 38′), or AB-glucose (τ = 60′). (B) OpgH is unable to localize to midcell in the absence of FtsZ. A strain encoding a sodium salicylate inducible copy of ftsZ (PL3180) was grown to mid-log phase and back-diluted into LB broth ± inducer (2.5 µM sodium salicylate) for 2.5 h. (C) The frequency of OpgH at midcell is independent of UDP-glucose. Congenic strains either encoding a deletion of a key gene in UDP-glucose biosynthesis (pgm::kan) or a mutation in OpgH's putative UDP-glucose binding site. (A–C) DNA is stained by DAPI. Bar = 5 µm. White arrowheads indicate OpgH midcell localization. OpgH is in green and FtsZ is in red in the overlays. The percent covariance of FtsZ and OpgH at midcell is indicated below the micrographs.
Figure 4
Figure 4. The N-terminal cytoplasmic region of OpgH is necessary and sufficient to inhibit cell division.
(A) A schematic representation of the inner-membrane glucosyltransferase OpgH . (B) Overexpression of OpgHN increases cell size in the opgH::kan strain. Micrographs of cells encoding arabinose inducible N-terminal thioredoxin fusions to each of OpgH's cytoplasmic domains cultured in LB±0.5% arabinose. Cells are stained with FM4-64. Bar = 5 µm. (C) Cell area measurements of cells with the various thio-opgH-his constructs. Cells were cultured in LB with either 0% arabinose (dark red bars) or 0.5% arabinose (light red bars). Error bars equal standard deviation (n = 3). (D) Immunofluorescence micrographs of various Para::thio-opgH-his constructs following 2 h of induction in LB+0.5% arabinose. Overlays of OpgH (green) and FtsZ (red) localization are on the bottom row. Bar = 3 µm. See also Figure S7 (localization data on additional deletion constructions).
Figure 5
Figure 5. OpgHN is an inhibitor of FtsZ assembly.
(A) Induction of OpgH inhibits FtsZ assembly in vivo. Cells were sampled and imaged for immunofluorescence microscopy at 25 minute intervals following the induction of either thio-his (black squares), thio-opgH-his (dark grey diamonds), or thio-opgHN-his (light grey circles). Cells were cultured in LB. >200 cells were evaluated per sample. Representative α-FtsZ immunofluorescence micrographs from time points 0′ and 150′ are shown in the lower left. (B) Mutations that disrupt synthesis of UDP-glucose or OpgH itself suppress the lethality of MinD overexpression. MinD is overexpressed by ∼2-fold, which is at the threshold of lethality in WT. Error bars equals standard deviation (n = 3). (See Figure S2 for relative MinD expression levels.) (C) A representative 90° angle light scattering plot of FtsZ assembly ± OpgHN. FtsZ is at 5 µM, OpgHN is at 10 µM. Arrow indicates addition of 1 mM GTP. (D) Concentration-dependent inhibition of FtsZ polymerization by OpgHN. The ratio of FtsZ to OpgHN is listed below. FtsZ is at 5 µM in all cases. (See Figure S9A, S9B for additional controls.)
Figure 6
Figure 6. OpgHN appears to function as an FtsZ monomer sequestering protein.
(A) Concentration-dependent inhibition of FtsZ's GTPase activity by OpgHN. The GTP hydrolysis rate of 5 µM FtsZ is shown at differing ratios of OpgHN. OpgHN alone is at 5 µM. Error bars equal standard deviation (n = 3). (B) FtsZ GTPase rates at increasing concentrations of OpgHN. The critical concentration for assembly of FtsZ was determined at OpgHN concentrations of 0 µM, 2.5 µM, 5 µM, or 10 µM. (See Figure S9C, S9D for additional controls.)
Figure 7
Figure 7. Glucosyltransferase OpgH couples cell size to nutritional availability and growth rate in E. coli.
(A) The nucleotide sugar UDP-glucose acts as a proxy for nutritional status to ensure cells maintain an optimal size for a given growth rate. OpgH blocks division by inhibiting assembly of the essential bacterial cytoskeleton protein FtsZ. OpgH bound to UDP-glucose assumes a conformation where the N-terminus is able to interact with FtsZ. This interaction effectively reduces the pool of FtsZ able to participate in the formation and maturation of the FtsZ ring. (B) In nutrient-poor conditions, UDP-glucose is less available and no longer serves to promote interaction between OpgH and FtsZ. Consequently, division is unobstructed and cell size does not increase. (C) Evolutionarily divergent organisms E. coli and B. subtilis both utilize UDP-glucose and unrelated glucosyltransferases to coordinate growth rate-dependent size homeostasis. Both organisms have co-opted sugar transferases activated by UDP-glucose to antagonize assembly of FtsZ by different mechanisms.

References

    1. Chien AC, Hill NS, Levin PA (2012) Cell size control in bacteria. Curr Biol 22: R340–349. - PMC - PubMed
    1. Schaechter M, Maaløe O, Kjeldgaard NO (1958) Dependency on medium and temperature of cell size and chemical composition during balanced grown of Salmonella typhimurium . J Gen Microbiol 19: 592–606. - PubMed
    1. Pierucci O, Helmstetter CE, Rickert M, Weinberger M, Leonard AC (1987) Overexpression of the dnaA gene in Escherichia coli B/r: chromosome and minichromosome replication in the presence of rifampin. J Bacteriol 169: 1871–1877. - PMC - PubMed
    1. Sargent MG (1975) Control of cell length in Bacillus subtilis . J Bacteriol 123: 7–19. - PMC - PubMed
    1. Fantes P, Nurse P (1977) Control of cell size at division in fission yeast by a growth-modulated size control over nuclear division. Exp Cell Res 107: 377–386. - PubMed

Publication types

MeSH terms