. 2013 Aug 2:7:26.
doi: 10.3389/fnana.2013.00026. eCollection 2013.

Neuroanatomical differences in visual, motor, and language cortices between congenitally deaf signers, hearing signers, and hearing non-signers

Affiliations

Neuroanatomical differences in visual, motor, and language cortices between congenitally deaf signers, hearing signers, and hearing non-signers

John S Allen et al. Front Neuroanat. .

Abstract

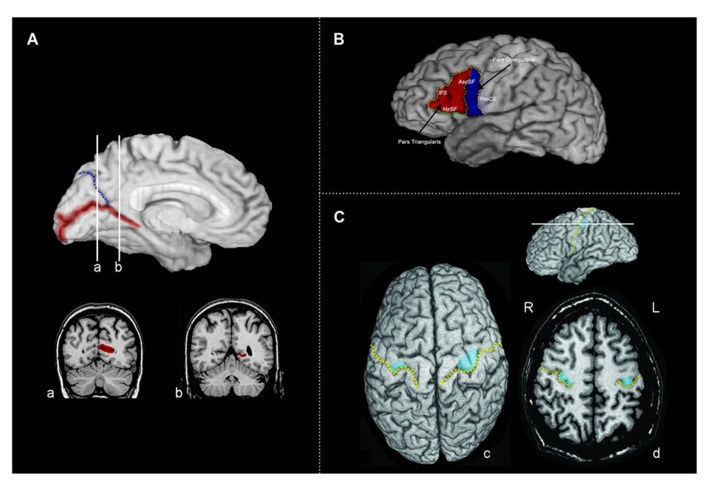
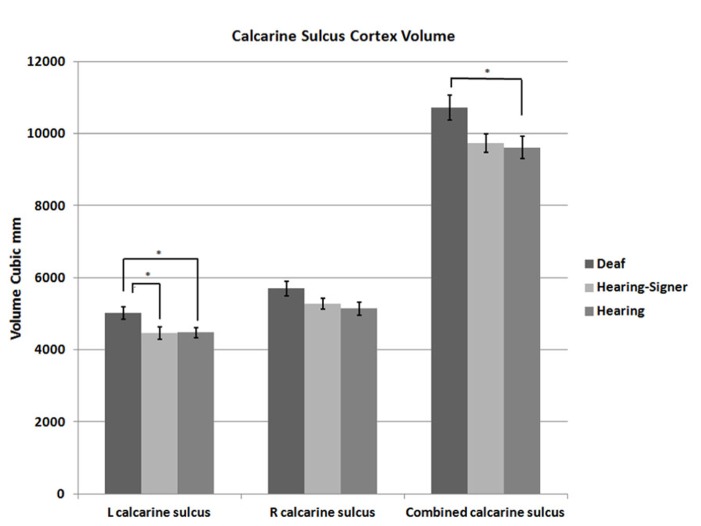
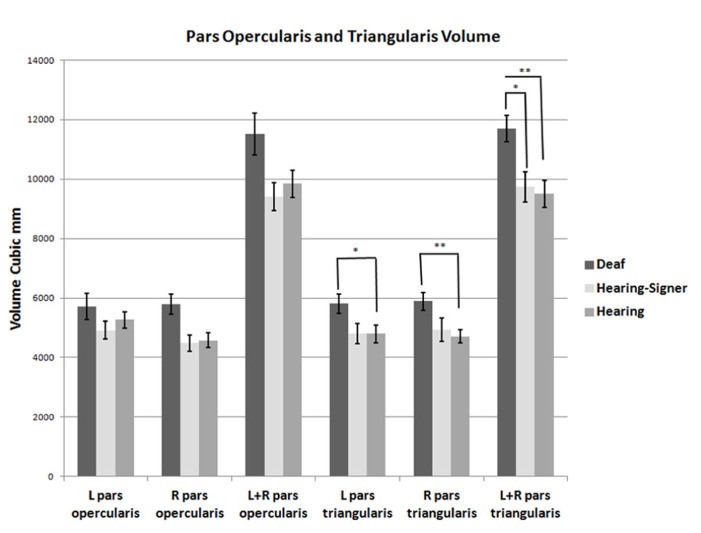
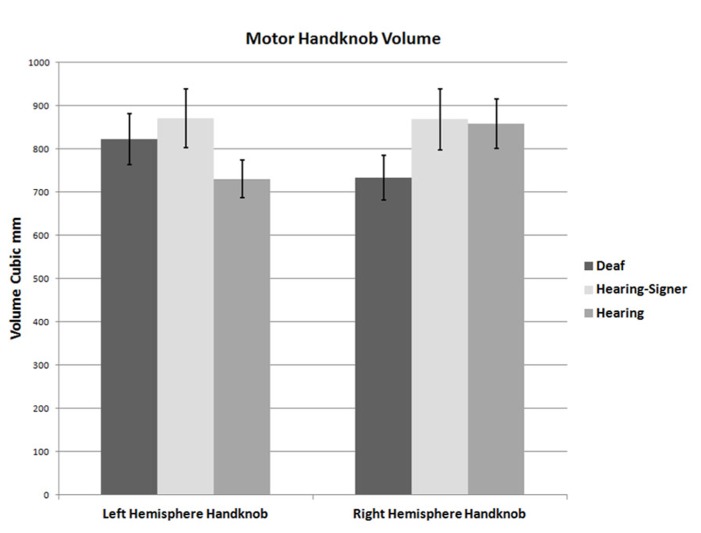
WE INVESTIGATED EFFECTS OF SIGN LANGUAGE USE AND AUDITORY DEPRIVATION FROM BIRTH ON THE VOLUMES OF THREE CORTICAL REGIONS OF THE HUMAN BRAIN: the visual cortex surrounding the calcarine sulcus in the occipital lobe; the language-related cortex in the inferior frontal gyrus (pars triangularis and pars opercularis); and the motor hand region in the precentral gyrus. The study included 25 congenitally deaf participants and 41 hearing participants (of which 16 were native sign language users); all were right-handed. Deaf participants exhibited a larger calcarine volume than hearing participants, which we interpret as the likely result of cross-modal compensation and/or dynamic interactions within sensory neural networks. Deaf participants also had increased volumes of the pars triangularis bilaterally compared to hearing signers and non-signers, which we interpret is related to the increased linguistic demands of speech processing and/or text reading for deaf individuals. Finally, although no statistically significant differences were found in the motor hand region for any of the groups, the deaf group was leftward asymmetric, the hearing signers essentially symmetric and the hearing non-signers were rightward asymmetric - results we interpret as the possible result of activity-dependent change due to life-long signing. The brain differences we observed in visual, motor, and language-related areas in adult deaf native signers provide evidence for the plasticity available for cognitive adaptation to varied environments during development.

Keywords: calcarine; deaf; inferior frontal gyrus; morphometry; motor hand region; sign language.


Figures

FIGURE 1
FIGURE 1
(A) The calcarine sulcus. The calcarine sulcus cortex (red) ROI projected to the mesial surface of the left hemisphere. Following Brodmann’s demarcation of area 17, both banks were traced posterior to the intersection of the calcarine sulcus and the parieto-occipital sulcus (blue) (coronal slice a), but only the lower bank of sulcus was traced anterior to this intersection (coronal slice b). (B) Broca’s area (left hemisphere) of the inferior frontal gyrus divided into the pars triangularis (PTri, red) and pars opercularis (POp, blue). Regions of interest were defined and traced as described in Section “Materials and Methods,” following Keller et al. (2007). IFS, inferior frontal sulcus (yellow); AscSF, ascending branch of the Sylvian fissure (coral); HzSF, horizontal branch of the Sylvian fissure (green); PreCS, precentral sulcus (white). (C) Tracing the motor handknob. (c) The position of the motor handknob (blue) is projected to the surface of the precentral gyrus. The central sulcus is indicated by the broken gold line. (d) An axial slice demonstrating the two classic forms of the handknob: the epsilon form in the right hemisphere and the omega form in the left hemisphere. All volumetric tracing of the handknob was done on contiguous 1-mm axial slices. R, right; L, left.
FIGURE 2
FIGURE 2
Calcarine sulcus cortex volume. Deaf individuals have significantly larger calcarine volume than hearing individuals (error bars: ±1 standard error; *p < 0.05).
FIGURE 3
FIGURE 3
Volumes of the pars opercularis and pars triangularis. The pars triangularis is significantly larger in deaf compared to hearing individuals (error bars: ±1 standard error; *p < 0.05; **p > 0.01).
FIGURE 4
FIGURE 4
Volumes of the left and right handknobs (error bars: ±1 standard error).

References

    1. Allen J. S., Damasio H., Grabowski T. (2002). Normal neuroanatomical variation in the human brain: an MRI-volumetric study. Am. J. Phys. Anthropol. 118 341–358 10.1002/ajpa.10092 - DOI - PubMed
    1. Allen J. S., Damasio H., Grabowski T. J., Bruss J., Zhang W. (2003). Sexual dimorphism and asymmetries in the gray–white composition of the human cerebrum. Neuroimage 18 880–894 10.1016/S1053-8119(03)00034-X - DOI - PubMed
    1. Allen J. S., Emmorey K., Bruss J., Damasio H. (2008a). Morphology of the insula in relation to hearing status and sign language experience. J. Neurosci. 28 11900–11905 10.1523/JNEUROSCI.3141-08.2008 - DOI - PMC - PubMed
    1. Allen J. S., Bruss J., Mehta S., Grabowski T., Brown C. K., Damasio H. (2008b). Effects of spatial transformation on regional brain volume estimates. Neuroimage 42 535–547 10.1016/j.neuroimage.2008.05.047 - DOI - PMC - PubMed
    1. Amunts K., Malikovic A., Mohlberg H., Schormann T., Ziles K. (2000). Brodmann areas 17 and 18 brought into stereotaxic space – where and how variable? Neuroimage 11 66–84 10.1006/nimg.1999.0516 - DOI - PubMed