. 2013 Jul 30;8(7):e68425.
doi: 10.1371/journal.pone.0068425. Print 2013.

Flow cytometric quantification of all phases of the cell cycle and apoptosis in a two-color fluorescence plot

Affiliations

Flow cytometric quantification of all phases of the cell cycle and apoptosis in a two-color fluorescence plot

Christine Vignon et al. PLoS One. .

Abstract

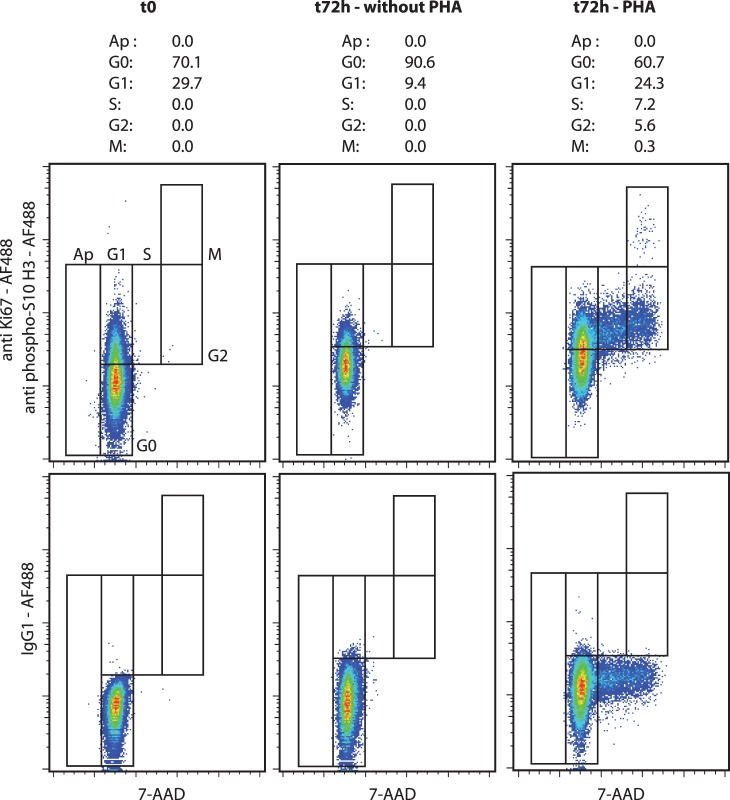
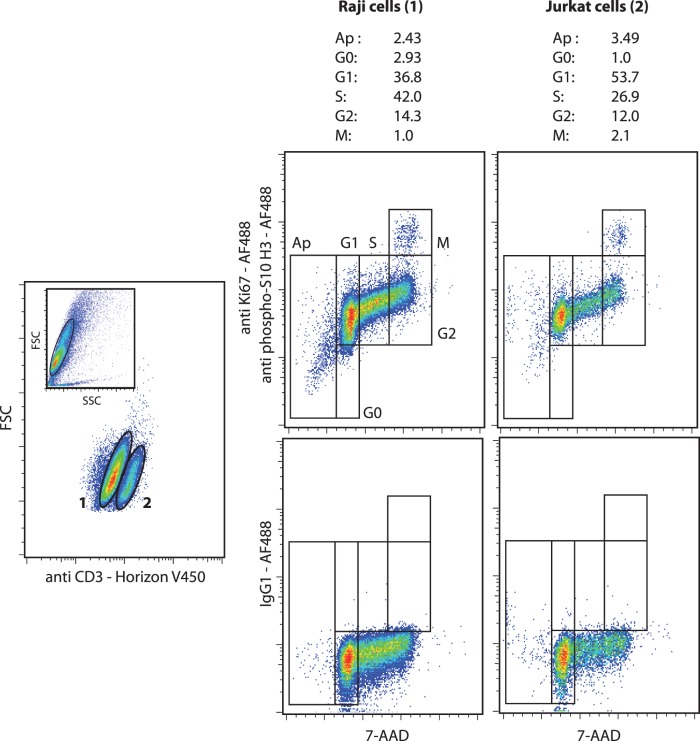
An optimal technology for cell cycle analysis would allow the concomitant measurement of apoptosis, G0, G1, S, G2 and M phases in combination with cell surface phenotyping. We have developed an easy method in flow cytometry allowing this discrimination in an only two-color fluorescent plot. It is based on the concomitant use of 7-amino-actinomycin D and the antibodies anti-Ki67 and anti-phospho(Ser10)-histone H3, both conjugated to Alexa Fluor®488 to discriminate G0 and M phases, respectively. The method is particularly valuable in a clinical setting as verified in our laboratory by analyzing human leukemic cells from marrow samples or after exposure to cell cycle modifiers.


Conflict of interest statement

Competing Interests: The authors have declared that no competing interests exist.

Figures

Figure 1
Figure 1. Cell cycle analysis of human KG1a leukemic cell line exposed to cell cycle modifiers.
The cells were stained with 7-amino-actinomycin D (7-AAD) and antibodies anti-Ki67 and anti-phospho(Ser10)-histone H3 conjugated to Alexa Fluor®488. An isotype control staining with Alexa Fluor®488 mouse IgG1 was performed. (Left) Effects of camptothecin (1 µM, 6 h, 37°C, 5% CO2). The histograms present the proportions of apoptosis and all cell cycle phases normalized to those of the untreated leukemic cells. (Right) Effects of contact with bone marrow primary mesenchymal stromal/stem cells (MSCs) (72 h, 37°C, 5% CO2). The leukemic cells were identified by concomitant staining with APC-Cy7-conjugated anti-CD45 mAb. The histograms present the proportions of apoptosis and all cell cycle phases normalized to those of the leukemic cells without MSCs. (representative experiment).
Figure 2
Figure 2. Cell cycle analysis of human MV4–11 leukemic cell line exposed to AZD8055.
The cells were stained with 7-AAD and antibodies anti-Ki67 and anti-phospho(Ser10)-histone H3 conjugated to Alexa Fluor®488. An isotype control staining with Alexa Fluor®488 mouse IgG1 was performed. Effects of AZD8055 (10 nM and 100 nM, 24 h, 37°C, 5% CO2). The results present the percentage of cells in the apoptosis and all cell cycle phases. (representative experiment).
Figure 3
Figure 3. Cell cycle analysis of human lymphocytes exposed to PHA.
The cells were stained with 7-AAD and antibodies anti-Ki67 and anti-phospho(Ser10)-histone H3 conjugated to Alexa Fluor®488. An isotype control staining with Alexa Fluor®488 mouse IgG1 was performed. Effects of PHA (170 µg/mL, 72 h, 37°C, 5% CO2). The results present the percentage of cells in the apoptosis and all cell cycle phases. (representative experiment).
Figure 4
Figure 4. Cell cycle analysis of human KG1a leukemic cell line exposed to colcemid.
The cells were stained with 7-AAD and antibodies anti-Ki67 and anti-phospho(Ser10)-histone H3 conjugated to Alexa Fluor®488. An isotype control staining with Alexa Fluor®488 mouse IgG1 was performed. Effects of colcemid (0.1 µg/mL, 30 min and 1 h, 37°C, 5% CO2). The results present the percentage of cells in the apoptosis and all cell cycle phases. (representative experiment).
Figure 5
Figure 5. Cell cycle analysis cell subpopulations in mixed B and T cell suspension (70% Raji and 30% Jurkat cells).
The cells were stained with 7-AAD, Alexa Fluor®488-conjugated anti-Ki67, Alexa Fluor®488-conjugated anti-phospho(Ser10)-histone H3 and Horizon™ V450-conjugated anti-CD3 antibodies. An isotype control staining with Alexa Fluor®488 mouse IgG1 was performed. Lymphocytes were identified by CD3/FSC gating. (representative experiment).
Figure 6
Figure 6. Cell cycle analysis of bone marrow cells of patient suffering from AML.
The cells were stained with 7-AAD, Alexa Fluor®488-conjugated anti-Ki67, Alexa Fluor®488-conjugated anti-phospho(Ser10)-histone H3 and APC-Cy7-conjugated anti-CD45 antibodies. An isotype control staining with Alexa Fluor®488 mouse IgG1 was performed. The leukoblasts, lymphocytes and granulocytic-lineage cells were identified by CD45/SSC gating. (representative analysis).

References

    1. Schwarting R, Gerdes J, Niehus J, Jaeschke L, Stein H (1986) Determination of the growth fraction in cell suspensions by flow cytometry using the monoclonal antibody Ki-67. J Immunol Methods 90: 65–70. - PubMed
    1. Gurley LR, D'Anna JA, Barham SS, Deaven LL, Tobey RA (1978) Histone phosphorylation and chromatin structure during mitosis in Chinese hamster cells. Eur J Biochem 84: 1–15. - PubMed
    1. Zelenin AV, Poletaev AI, Stepanova NG, Barsky VE, Kolesnikov VA, et al. (1984) 7-Amino-actinomycin D as a specific fluorophore for DNA content analysis by laser flow cytometry. Cytometry 5: 348–354. - PubMed
    1. Herault O, Domenech J, Degenne M, Bremond JL, Sensebe L, et al. (1998) All-trans-retinoic acid up-regulates CD38 but not c-Kit antigens on human marrow CD34+ cells without recruitment into cell cycle. Br J Haematol 103: 343–350. - PubMed
    1. Herault O, Gallay N, Domenech J, Colombat P, Binet C (2004) Pharmacological doses of all-trans retinoic acid promote G0/G1 transition and G1 arrest of normal human marrow CD34+ cells. Cell Death Differ 11: S207–209. - PubMed

Publication types