. 2013 Jul 23;8(7):e69540.
doi: 10.1371/journal.pone.0069540. Print 2013.

A mouse model of familial ALS has increased CNS levels of endogenous ubiquinol9/10 and does not benefit from exogenous administration of ubiquinol10

Affiliations

A mouse model of familial ALS has increased CNS levels of endogenous ubiquinol9/10 and does not benefit from exogenous administration of ubiquinol10

Jacopo Lucchetti et al. PLoS One. .

Abstract

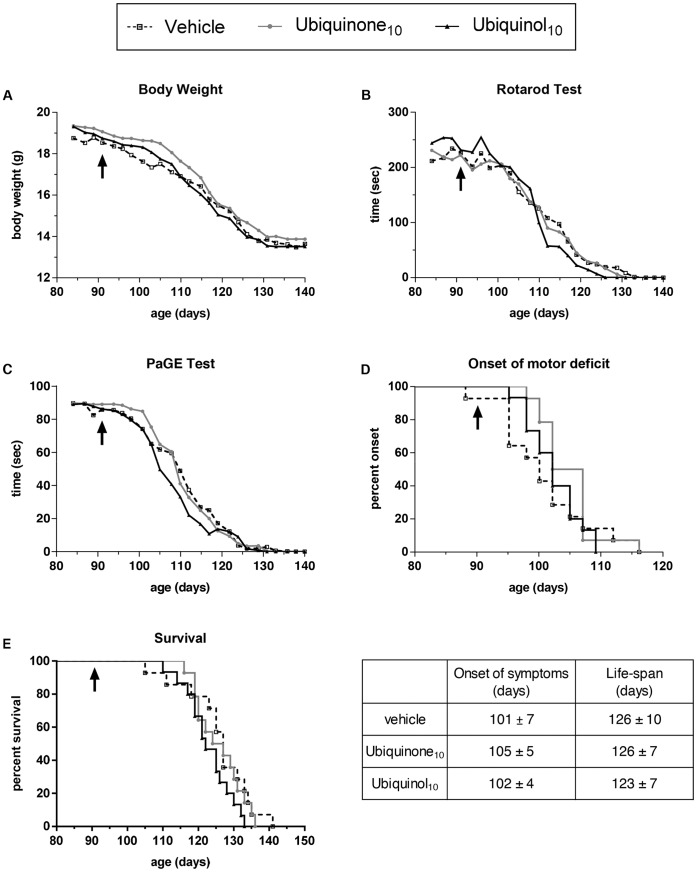
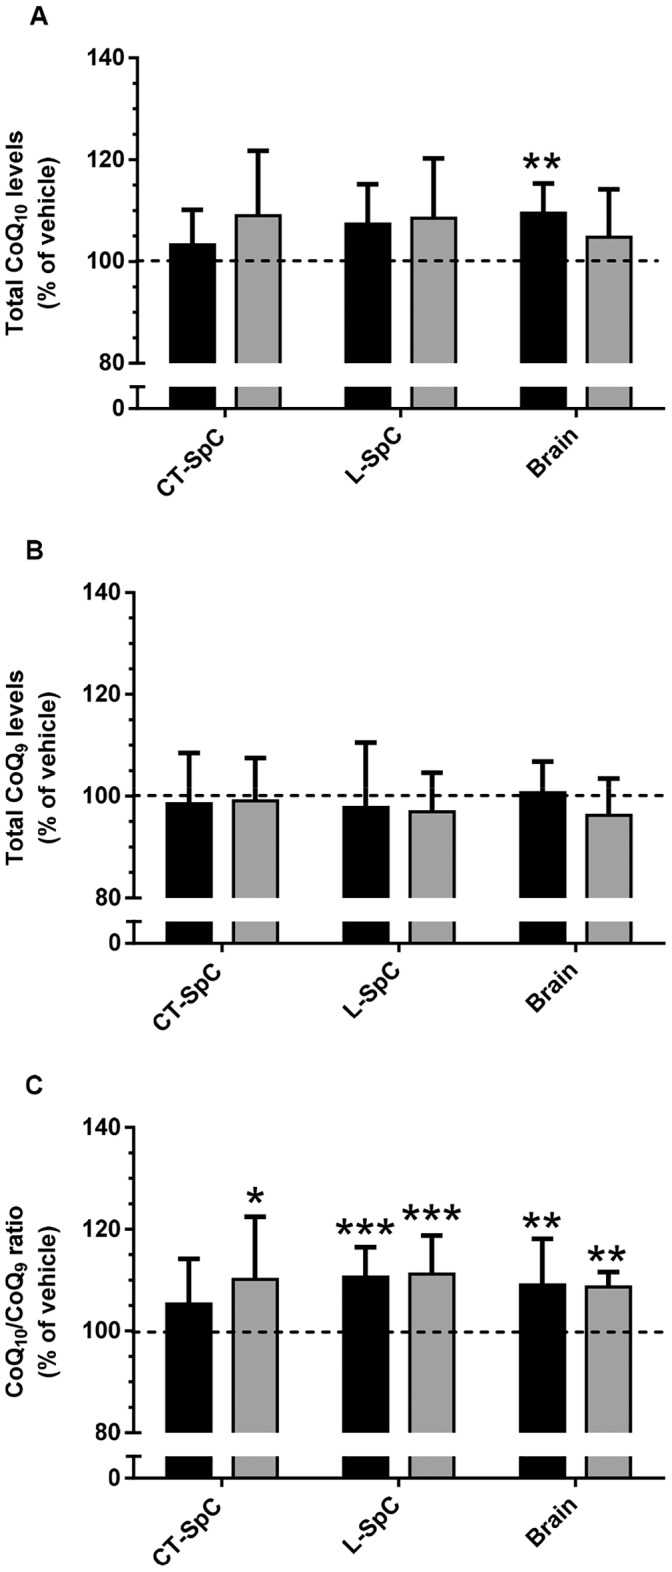
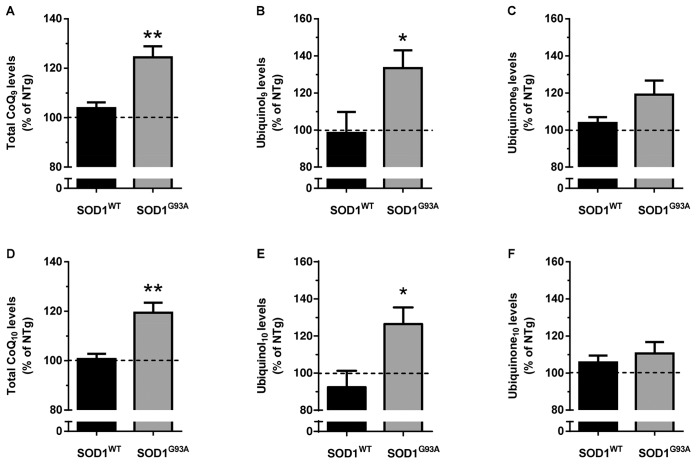
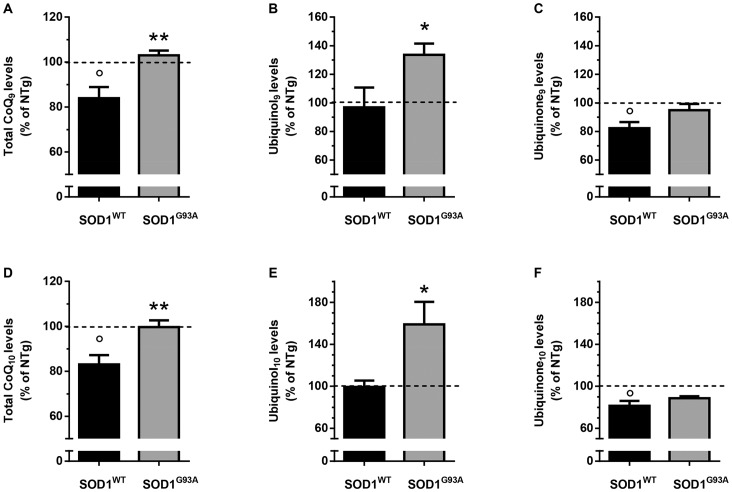
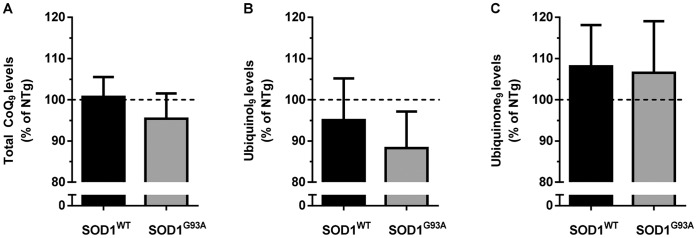
Oxidative stress and mitochondrial impairment are the main pathogenic mechanisms of Amyotrophic Lateral Sclerosis (ALS), a severe neurodegenerative disease still lacking of effective therapy. Recently, the coenzyme-Q (CoQ) complex, a key component of mitochondrial function and redox-state modulator, has raised interest for ALS treatment. However, while the oxidized form ubiquinone10 was ineffective in ALS patients and modestly effective in mouse models of ALS, no evidence was reported on the effect of the reduced form ubiquinol10, which has better bioavailability and antioxidant properties. In this study we compared the effects of ubiquinone10 and a new stabilized formulation of ubiquinol10 on the disease course of SOD1(G93A) transgenic mice, an experimental model of fALS. Chronic treatments (800 mg/kg/day orally) started from the onset of disease until death, to mimic the clinical trials that only include patients with definite ALS symptoms. Although the plasma levels of CoQ10 were significantly increased by both treatments (from <0.20 to 3.0-3.4 µg/mL), no effect was found on the disease progression and survival of SOD1(G93A) mice. The levels of CoQ10 in the brain and spinal cord of ubiquinone10- or ubiquinol10-treated mice were only slightly higher (≤10%) than the endogenous levels in vehicle-treated mice, indicating poor CNS availability after oral dosing and possibly explaining the lack of pharmacological effects. To further examine this issue, we measured the oxidized and reduced forms of CoQ9/10 in the plasma, brain and spinal cord of symptomatic SOD1(G93A) mice, in comparison with age-matched SOD1(WT). Levels of ubiquinol9/10, but not ubiquinone9/10, were significantly higher in the CNS, but not in plasma, of SOD1(G93A) mice, suggesting that CoQ redox system might participate in the mechanisms trying to counteract the pathology progression. Therefore, the very low increases of CoQ10 induced by oral treatments in CNS might be not sufficient to provide significant neuroprotection in SOD1(G93A) mice.


Conflict of interest statement

Competing Interests: The authors have received funding from a commercial source (Sintofarm S.p.A.). This does not alter the authors' adherence to all the PLOS ONE policies on sharing data and materials.

Figures

Figure 1
Figure 1. Ubiquinol10 chronic treatment has no effect on disease course in SOD1G93A mice.
Effect of oral treatment with 800 mg/kg/day ubiquinone10, ubiquinol10 or vehicle, on motor dysfunction and disease progression of 129Sv SOD1G93A mice (n = 15 mice per group). Treatment started at the age of 91 days (arrows) until the sacrifice (at the end-stage of the disease, when mice were unable to right themselves within 10 seconds after being placed on both sides). Treatment with ubiquinone10 or ubiquinol10 had no significant effects on body weight (A), on the latency of rotarod (B) and PaGE test (C) (Two-way ANOVA), or on disease onset (D) and survival length (E). Each point represents the mean; for sake of clarity standard deviations are not indicated but they were always less than 15% of the value. Table reports the mean and standard deviations of symptoms onset and life-span for each group.
Figure 2
Figure 2. CoQ9/10 levels in brain and spinal cord of SOD1G93A chronically treated with ubiquinol10 or ubiquinone10.
Total levels of CoQ10 (A) and CoQ9 (B), and CoQ10/CoQ9 ratio (C), in brain, and in cervicothoracic (CT-SpC) and lumbar (L-SpC) spinal cord of mice chronically treated with 800 mg/kg ubiquinol10 (black) or ubiquinone10 (grey). Each value is the mean±SEM of 10–12 mice and is indicated as percentage of levels measured in mice treated with vehicle. * P<0.05, ** P<0.01 compared to vehicle (Dunnet’s multiple comparison tests following One-way ANOVA).
Figure 3
Figure 3. Increased levels of ubiquinol9/10 in the brain of symptomatic SOD1G93A mice.
Endogenous brain levels of CoQ9 (A–C) and CoQ10 (D–F) in 16 week-old male 129Sv SOD1WT and SOD1G93A mice are shown as percentage of the levels measured in age-matched 129Sv non-transgenic mice (absolute values in table S1). Panels A, D show the total CoQs levels, whereas panels B, E and panels C, F show the reduced and oxidized forms, respectively. Each value is the mean±SEM of 4–7 mice. * P<0.05, ** P<0.01 compared to SOD1WT mice (Student’s T-test).
Figure 4
Figure 4. Increased levels of ubiquinol9/10 in the lumbar spinal cord of symptomatic SOD1G93A mice.
Endogenous levels of CoQ9 (A–C) and CoQ10 (D–F) in the lumbar spinal cord of male 16 week-old 129Sv SOD1WT and SOD1G93A mice are shown as percentage of the levels measured in age-matched 129Sv non-transgenic mice (absolute values in table S1). Panels A, D show the total CoQs levels, whereas panels B, E and panels C, F show the reduced and oxidized forms, respectively. Each value is mean±SEM of 4–7 mice. * P<0.05, ** P<0.01 compared to SOD1WT mice; ° P<0.05 compared to 129Sv NTg mice (Student’s T-test).
Figure 5
Figure 5. Unchanged plasma levels of ubiquinol9 in symptomatic SOD1G93A mice.
Levels of CoQ9 (A), ubiquinol9 (B) and ubiquinone9 (C) in plasma of male 16 week-old 129Sv SOD1WT and SOD1G93A mice are shown as percentage of the levels measured in age-matched 129Sv non-transgenic mice (table S1). Each value is mean±SEM of 4–7 mice.

References

    1. Tran UC, Clarke CF (2007) Endogenous synthesis of coenzyme Q in eukaryotes. Mitochondrion 7 Suppl: S62–71 - PMC - PubMed
    1. Lass A, Agarwal S, Sohal RS (1997) Mitochondrial ubiquinone homologues, superoxide radical generation, and longevity in different mammalian species. J Biol Chem 272: 19199–19204. - PMC - PubMed
    1. Tang PH, Miles MV, Miles L, Quinlan J, Wong B, et al. (2004) Measurement of reduced and oxidized coenzyme Q9 and coenzyme Q10 levels in mouse tissues by HPLC with coulometric detection. Clin Chim Acta 341: 173–184. - PubMed
    1. Littarru GP, Langsjoen P (2007) Coenzyme Q10 and statins: biochemical and clinical implications. Mitochondrion 7 Suppl: S168–174 - PubMed
    1. Pravst I, Zmitek K, Zmitek J (2010) Coenzyme Q10 contents in foods and fortification strategies. Crit Rev Food Sci Nutr 50: 269–280. - PubMed

Publication types

MeSH terms

Supplementary concepts