. 2013 Jul 25;8(7):e69939.
doi: 10.1371/journal.pone.0069939. Print 2013.

Involvement of the clock gene Rev-erb alpha in the regulation of glucagon secretion in pancreatic alpha-cells

Affiliations

Involvement of the clock gene Rev-erb alpha in the regulation of glucagon secretion in pancreatic alpha-cells

Elaine Vieira et al. PLoS One. .

Abstract

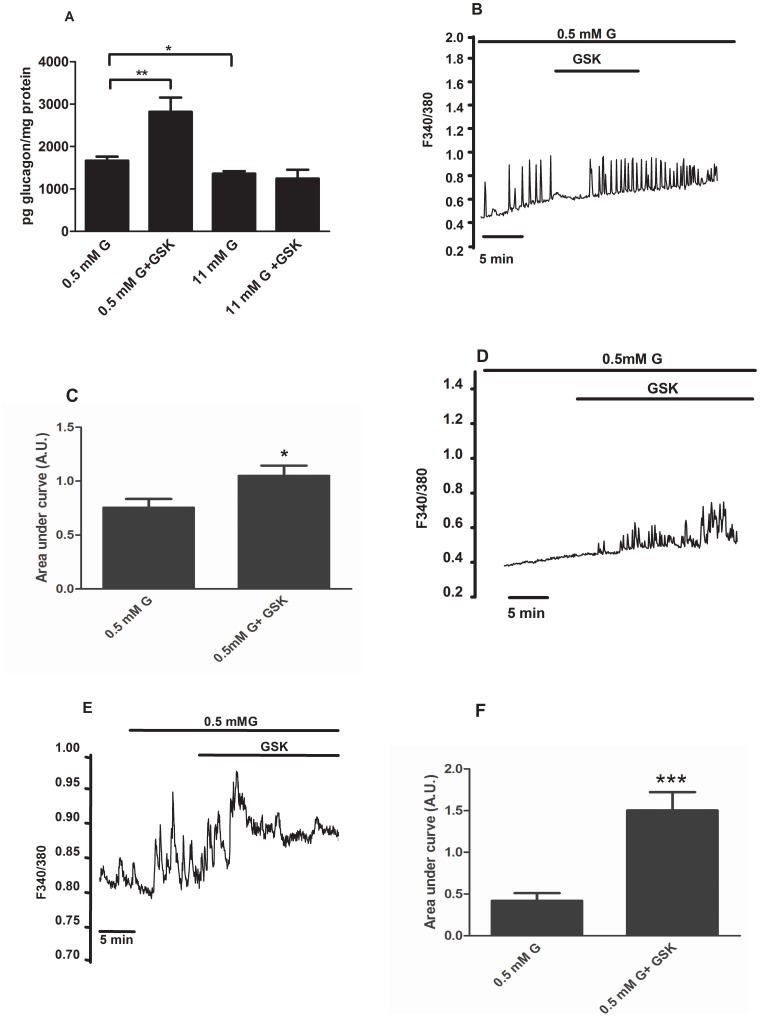
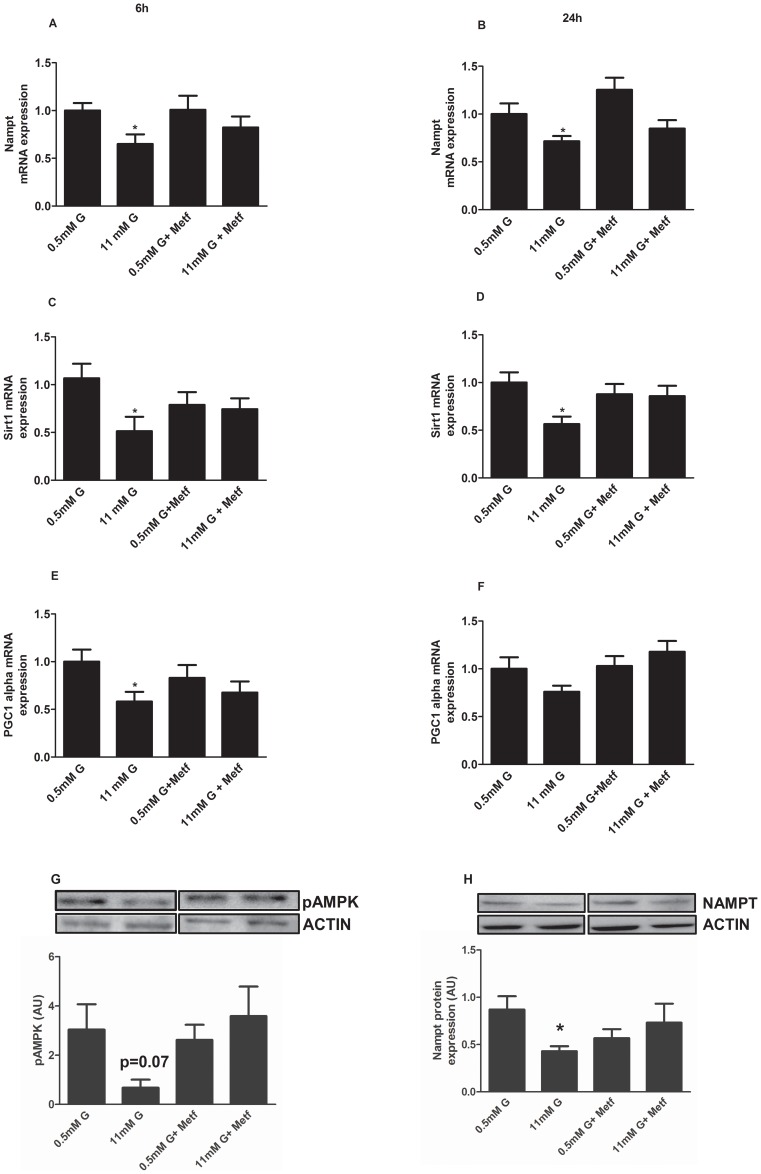
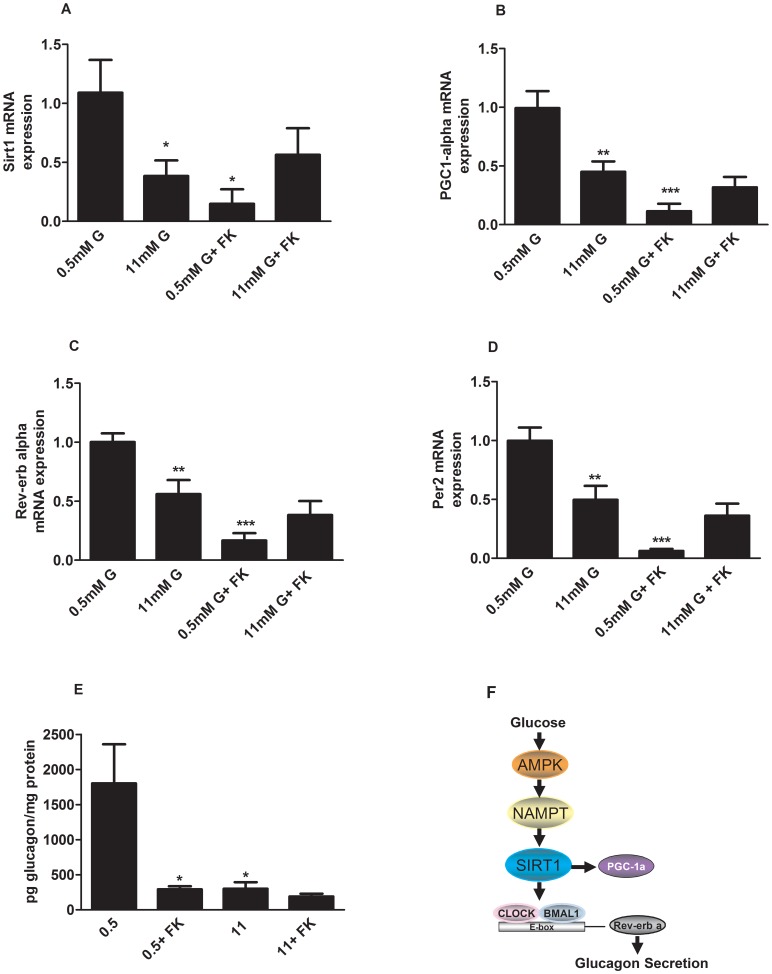
Disruption of pancreatic clock genes impairs pancreatic beta-cell function, leading to the onset of diabetes. Despite the importance of pancreatic alpha-cells in the regulation of glucose homeostasis and in diabetes pathophysiology, nothing is known about the role of clock genes in these cells. Here, we identify the clock gene Rev-erb alpha as a new intracellular regulator of glucagon secretion. Rev-erb alpha down-regulation by siRNA (60-70% inhibition) in alphaTC1-9 cells inhibited low-glucose induced glucagon secretion (p<0.05) and led to a decrease in key genes of the exocytotic machinery. The Rev-erb alpha agonist GSK4112 increased glucagon secretion (1.6 fold) and intracellular calcium signals in alphaTC1-9 cells and mouse primary alpha-cells, whereas the Rev-erb alpha antagonist SR8278 produced the opposite effect. At 0.5 mM glucose, alphaTC1-9 cells exhibited intrinsic circadian Rev-erb alpha expression oscillations that were inhibited by 11 mM glucose. In mouse primary alpha-cells, glucose induced similar effects (p<0.001). High glucose inhibited key genes controlled by AMPK such as Nampt, Sirt1 and PGC-1 alpha in alphaTC1-9 cells (p<0.05). AMPK activation by metformin completely reversed the inhibitory effect of glucose on Nampt-Sirt1-PGC-1 alpha and Rev-erb alpha. Nampt inhibition decreased Sirt1, PGC-1 alpha and Rev-erb alpha mRNA expression (p<0.01) and glucagon release (p<0.05). These findings identify Rev-erb alpha as a new intracellular regulator of glucagon secretion via AMPK/Nampt/Sirt1 pathway.


Conflict of interest statement

Competing Interests: Co-author Dr. Angel Nadal is a PLOS ONE Editorial Board member. This does not alter our adherence to all the PLOS ONE policies on sharing data and materials.

Figures

Figure 1
Figure 1. Glucose downregulates Rev-erb alpha gene expression in alphaTC1-9 cells and mouse pancreatic alpha cells.
(A) Gene expression of Rev-erb alpha in glucagon-secreting alphaTC1-9 cells, hypothalamus and liver (n = 5) The statistical significance was performed comparing the expression levels in alphaTC1-9 cells with the other tissues. (B) Intrinsic oscillations of Rev-erb alpha gene expression during 48 hours. AlphaTC1-9 cells were treated with 0.5 mM glucose (circles) and 11 mM glucose (square) for 48 hours (n = 6). The statistical significance was performed between the ZT (Zeitgeber Time) times comparing 0.5 mM and 11 mM. (C) Rev-erb alpha gene expression in alphaTC1-9 cells treated with 0.5 mM glucose and 11 mM glucose at ZT6 (n = 4–5). (D) Rev-erb alpha protein expression in alphaTC1-9 cells treated with 0.5 mM glucose and 11 mM glucose at ZT6 (n = 4). (E) Rev-erb alpha gene expression in primary mouse alpha-cells separated by FACS sorting and treated with 0.5 mM glucose and 11 mM glucose at ZT6 (n = 4). Alpha-cell enriched fraction: 80% alpha cells and 4% beta cells. Beta-cells enriched fraction: 75% beta-cells and no alpha-cells *p<0.05, **p<0.01, *** p<0.001. Data are expressed as mean ±S.E.M.
Figure 2
Figure 2. Rev-erb alpha regulates glucagon secretion in alphaTC1-9 cells.
(A) Rev-erb alpha gene expression and (B) protein expression from alphaTC1-9 cells treated for 24 hours with 50 nM control scramble siRNA (Sc) and 50 nM Rev-erb alpha siRNA(siRev) (n = 5). (C) Glucagon secretion after treatment with Sc and siRev in alphaTC1-9 cells (n = 5–6). *p<0.05, **p<0.01, *** p<0.001 versus Sc. Data are expressed as mean ±S.E.M.
Figure 3
Figure 3. Rev-erb-alpha regulates specific exocytotic genes in alphaTC1-9 cells.
(A) SNAP 25 gene expression (B) Vamp3 gene expression (C) Munc18 gene expression (D) Syntaxin1a gene expression in alphaTC1-9 cells after treatment with Sc and siRev for 24 hours (n = 6). *p<0.05 **p<0.01, versus control (Sc). Data are expressed as mean ±S.E.M.
Figure 4
Figure 4. Activation of Rev-erb alpha stimulates glucagon secretion and calcium signals in alphaTC1-9 cells and pancreatic alpha-cells.
(A) Glucagon secretion in alphaTC1-9 cells in the presence of 0.5 mM, 11 mM glucose and 10 µM of the Rev-erb alpha agonist GSK4112 (n = 7–8). (B) Intracellular calcium signals in alphaTC1-9 cells in the presence of 0.5 mM glucose and 10 µM of the Rev-erb alpha agonist GSK4112 (n = 42 cells). (C) Area under the curve calculated from experiments illustrated in 4B with alphaTC1-9 cells. (D) Intracellular calcium signals in alphaTC1-9 cells in the presence of 0.5 mM glucose and 10 µM of the Rev-erb alpha agonist GSK4112 (n = 24 cells). (E) Intracellular calcium measurements in primary mouse alpha cells in the presence of 0.5 mM glucose and 10 µM of Rev-erb alpha agonist GSK4112 (n = 14 cells). (F) Area under the curve calculated from experiments illustrated in 4E with primary alpha-cells. *p<0.05, **p<0.01, *** p<0.001. Data are expressed as mean ±S.E.M.
Figure 5
Figure 5. Inhibition of Rev-erb alpha inhibits glucagon secretion and calcium signals in alphaTC1-9 cells and pancreatic alpha-cells.
(A) Glucagon secretion from alphaTC1-9 cells in the presence with 0.5 mM, 11 mM glucose and 10 µM of the Rev-erb alpha antagonist SR8278 (n = 8). (B) Intracellular calcium signals in alphaTC1-9 cells in the presence of 0.5 mM glucose and 10 µM of the Rev-erb alpha antagonist SR8278 (n = 32 cells). (C) Area under the curve calculated from experiment 5B. *p<0.05, **p<0.01. Data are expressed as mean ±S.E.M.
Figure 6
Figure 6. Activation of AMPK prevents glucose inhibition of clock genes in alphaTC1-9 cells.
(A) Rev-erb alpha gene expression in alphaTC1-9 cells treated with 0.5 mM, 11 mM glucose or 500 µM Metformin for 6 hours (n = 5) and (B) 24 hours (n = 5). (C) Clock gene expression in alphaTC1-9 cells treated with 0.5 mM, 11 mM glucose or 500 µM Metformin for 6 hours (n = 5–6) and (D) 24 hours (n = 5–6). (E) Bmal1 gene expression in alphaTC1-9 cells treated with 0.5 mM, 11 mM glucose or 500 µM Metformin for 6 hours (n = 5–6) and (F) 24 hours (n = 5–6). (G) Per2 gene expression in alphaTC1-9 cells treated with 0.5 mM, 11 mM glucose or 500 µM Metformin for 6 hours (n = 5–6) and (H) 24 hours (n = 5–6). *p<0.05; **p<0.01. Data are expressed as mean ±S.E.M.
Figure 7
Figure 7. Activation of AMPK prevents glucose inhibition of Rev-erb alpha expression via Nampt-Sirt1 pathway in alphaTC1-9 cells.
(A) Nampt gene expression in alphaTC1-9 cells treated with 0.5 mM, 11 mM glucose or 500 µM Metformin for 6 hours (n = 5–6) and (B) 24 hours (n = 5–6). (C) Sirt-1 gene expression in alphaTC1-9 cells treated with 0.5 mM, 11 mM glucose or 500 µM Metformin for 6 hours (n = 5–6) and (D) 24 hours (n = 5–6). (E) PGC-1 alpha gene expression in alphaTC1-9 cells treated with 0.5 mM, 11 mM glucose or 500 µM Metformin for 6 hours (n = 5) and (F) 24 hours (n = 5–6). (G) AMPK phosphorylation (Thr172) in alphaTC1-9 cells treated with 0.5 mM, 11 mM glucose or 500 µM Metformin for 6 hours. (H) NAMPT protein expression in alphaTC1-9 cells treated with 0.5 mM, 11 mM glucose or 500 µM Metformin for 6 hours. *p<0.05. Data are expressed as mean ±S.E.M.
Figure 8
Figure 8. Nampt inhibition leads to decrease in Rev-erb alpha expression and glucagon secretion in alphaTC1-9 cells and pancreatic alpha cells.
(A) Sirt1 gene expression in alphaTC1-9 cells treated with 0.5 mM, 11 mM glucose or 500 nM FK 866 for 6 hours (n = 7). (B) PGC-1 alpha gene expression in alphaTC1-9 cells treated with 0.5 mM, 11 mM glucose or 500 nM FK 866 for 6 hours (n = 6–7). (C) Rev-erb alpha gene expression in alphaTC1-9 cells treated with 0.5 mM, 11 mM glucose or 500 nM FK 866 for 6 hours (n = 7). (D) Per2 gene expression in alphaTC1-9 cells treated with 0.5 mM, 11 mM glucose or 500 nM FK 866 for 6 hours (n = 7–8). (E) Glucagon secretion from mouse pancreatic islets stimulated for 1.5 hour with 0.5 mM, 11 mM glucose or 500 nM FK 866 (n = 6). *p<0.05, **p<0.01, *** p<0.001. Data are expressed as mean ±S.E.M. (F) Proposed model for regulation of glucagon secretion via an AMPK-Nampt-Sirt1-Rev-erb alpha mechanism. At low glucose concentrations AMPK is activated which will trigger the Nampt-Sirt pathway increasing Rev-erb alpha expression levels and glucagon secretion. Conversely, high glucose will inhibit AMPK-Nampt-Sirt pathway and consequently Rev-erb alpha expression levels leading to a decrease in glucagon release.

Similar articles

Cited by

References

    1. Green CB, Takahashi JS, Bass J (2008) The meter of metabolism. Cell 134: 728–742. - PMC - PubMed
    1. Lowrey PL, Takahashi JS (2004) Mammalian circadian biology: elucidating genome-wide levels of temporal organization. Annu Rev Genomics Hum Genet 5: 407–441. - PMC - PubMed
    1. Muhlbauer E, Wolgast S, Finckh U, Peschke D, Peschke E (2004) Indication of circadian oscillations in the rat pancreas. FEBS Lett 564: 91–96. - PubMed
    1. Panda S, Antoch MP, Miller BH, Su AI, Schook AB, et al. (2002) Coordinated transcription of key pathways in the mouse by the circadian clock. Cell 109: 307–320. - PubMed
    1. Vieira E, Nilsson EC, Nerstedt A, Ormestad M, Long YC, et al. (2008) Relationship between AMPK and the transcriptional balance of clock-related genes in skeletal muscle. Am J Physiol Endocrinol Metab 295: E1032–1037. - PubMed

Publication types

MeSH terms