. 2013 Jul 30;8(7):e70220.
doi: 10.1371/journal.pone.0070220. Print 2013.

Refining susceptibility loci of chronic obstructive pulmonary disease with lung eqtls

Affiliations

Refining susceptibility loci of chronic obstructive pulmonary disease with lung eqtls

Maxime Lamontagne et al. PLoS One. .

Abstract

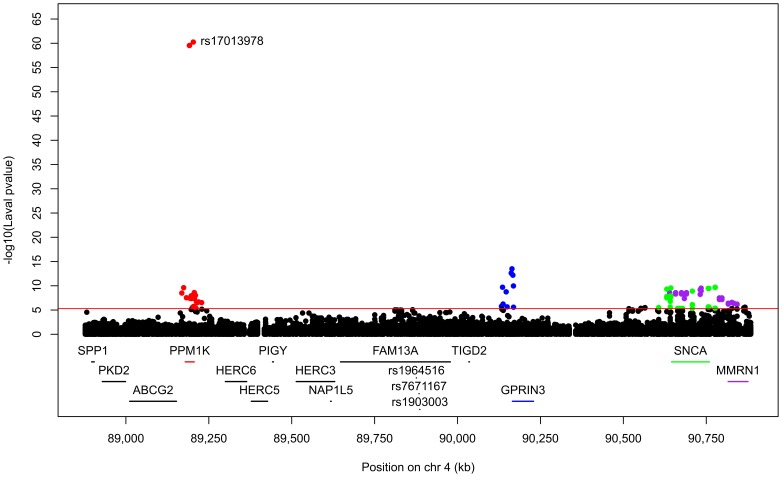
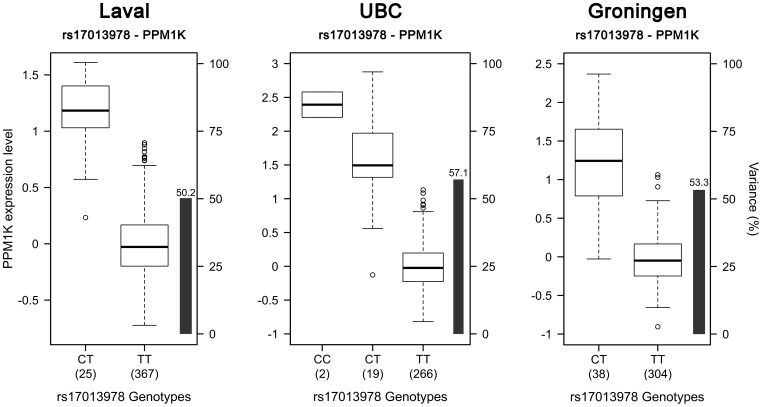
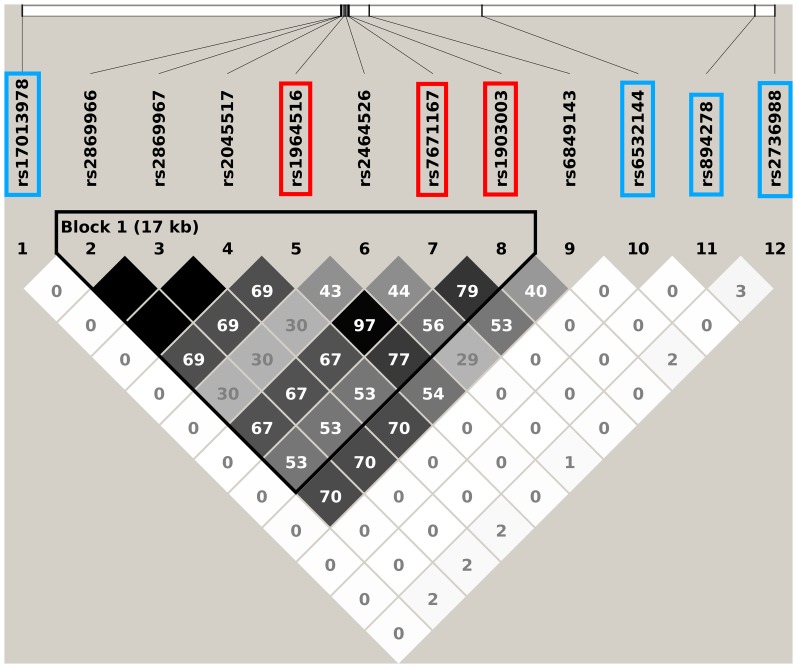
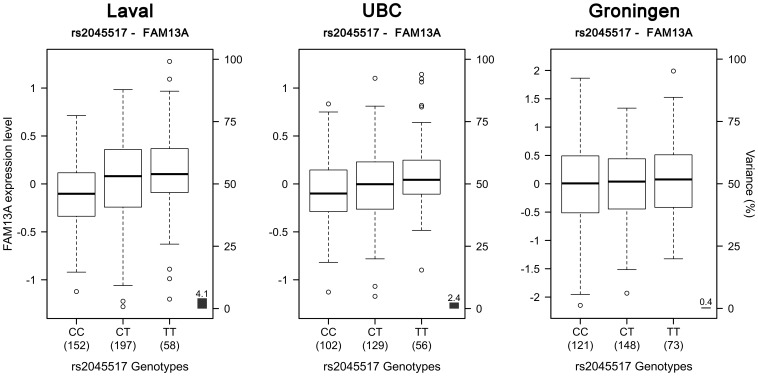
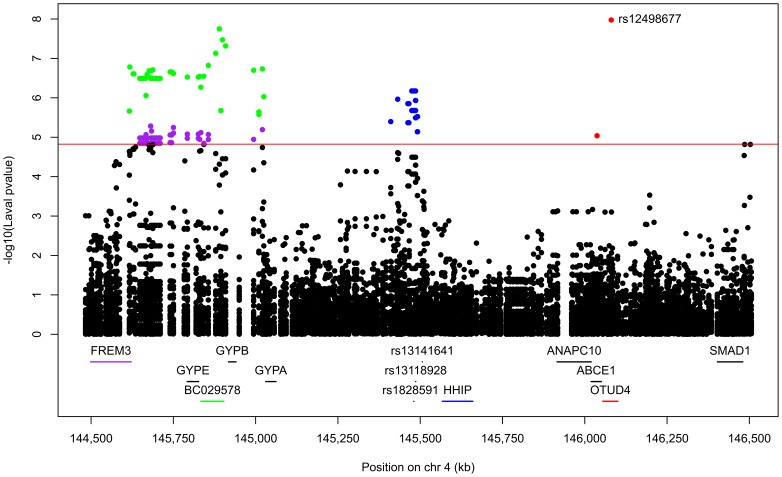
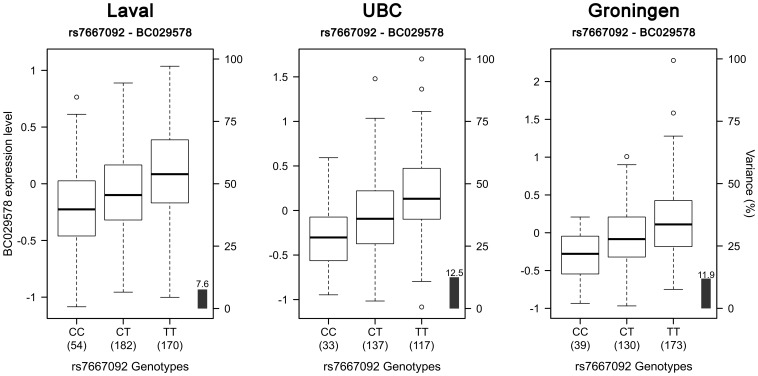
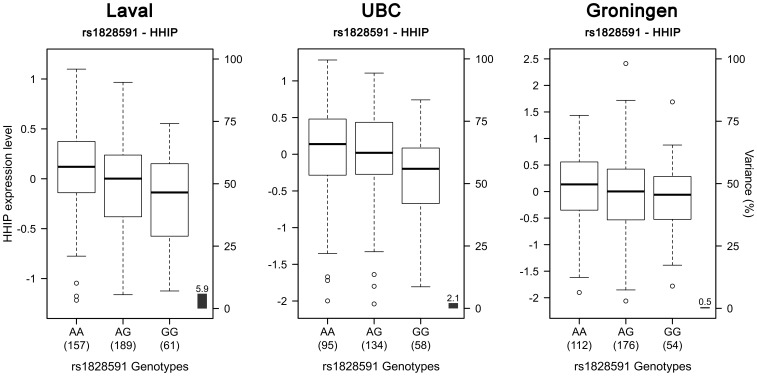
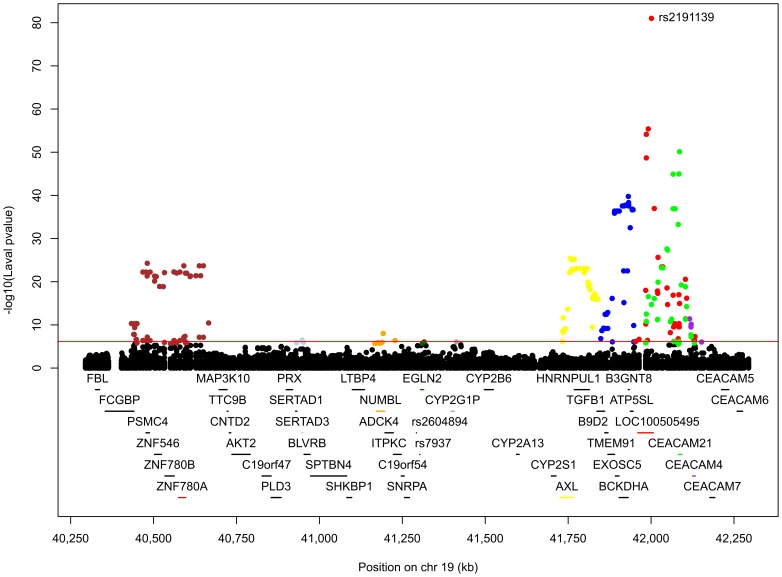
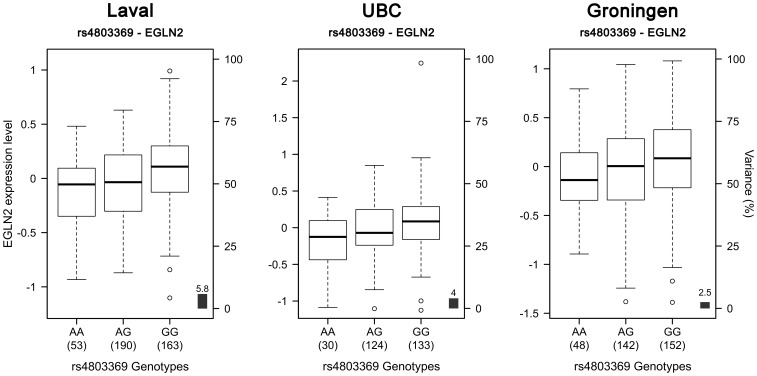
Chronic obstructive pulmonary disease (COPD) is the fourth leading cause of mortality worldwide. Recent genome-wide association studies (GWAS) have identified robust susceptibility loci associated with COPD. However, the mechanisms mediating the risk conferred by these loci remain to be found. The goal of this study was to identify causal genes/variants within susceptibility loci associated with COPD. In the discovery cohort, genome-wide gene expression profiles of 500 non-tumor lung specimens were obtained from patients undergoing lung surgery. Blood-DNA from the same patients were genotyped for 1,2 million SNPs. Following genotyping and gene expression quality control filters, 409 samples were analyzed. Lung expression quantitative trait loci (eQTLs) were identified and overlaid onto three COPD susceptibility loci derived from GWAS; 4q31 (HHIP), 4q22 (FAM13A), and 19q13 (RAB4B, EGLN2, MIA, CYP2A6). Significant eQTLs were replicated in two independent datasets (n = 363 and 339). SNPs previously associated with COPD and lung function on 4q31 (rs1828591, rs13118928) were associated with the mRNA expression of HHIP. An association between mRNA expression level of FAM13A and SNP rs2045517 was detected at 4q22, but did not reach statistical significance. At 19q13, significant eQTLs were detected with EGLN2. In summary, this study supports HHIP, FAM13A, and EGLN2 as the most likely causal COPD genes on 4q31, 4q22, and 19q13, respectively. Strong lung eQTL SNPs identified in this study will need to be tested for association with COPD in case-control studies. Further functional studies will also be needed to understand the role of genes regulated by disease-related variants in COPD.


Conflict of interest statement

Competing Interests: DN is a full time employee of Merck. This does not alter the authors' adherence to all the PLOS ONE policies on sharing data and materials.

Figures

Figure 1
Figure 1. Lung eQTLs on 4q22 in the Laval dataset.
Each dot represents an association test between one SNP and one probeset. Only dots above the red line are significant (p<5.10×10⁻⁶). Significant SNPs were regulating the expression levels of PPM1K in red, GPRIN3 in blue, SNCA in green and MMRN1 in purple. The SNP with the smaller p-value is indicated. SNPs previously associated with COPD are presented at the bottom.
Figure 2
Figure 2. Boxplots of gene expression levels in the lung for PPM1K according to genotype groups for SNP rs17013978.
The left y-axis shows the mRNA expression levels for PPM1K. The x-axis represents the three genotyped groups for SNP rs17013978. The right y-axis shows the proportion of the gene expression variance explained by the SNP (black bar). Each panel represents a different cohort: Laval (n = 392), UBC (n = 287), Groningen (n = 342). The eQTL p-values were 5.6×10−61, 2.8×10−51 and 3.8×10−55, respectively.
Figure 3
Figure 3. Linkage disequilibrium plot of selected SNPs on the 4q22 locus in the 1000 Genome Project.
The white horizontal bar on the upper part of the figure illustrates the location of SNPs on a physical scale. LD values (r2) are indicated in each box. The color of the squares illustrates the strength of pairwise r2 values on a black and white scale where black indicates perfect LD (r2 = 1) and white indicates perfect equilibrium (r2 = 0). The genotypes are from the 1000 Genome Project interim phase 1 release (2010/11/23). Red rectangles are SNPs previously associated with COPD (Table 2). Blue rectangles are the most significant eQTL-SNPs for the four regulated genes found on 4q22 (Figure 1). The other illustrated SNPs were genotyped in our study and in LD (r2>0.5) with COPD SNPs.
Figure 4
Figure 4. Boxplots of gene expression levels in the lung for FAM13A according to genotype groups for SNP rs2045517.
The left y-axis shows the mRNA expression levels for FAM13A. The x-axis represents the three genotype groups for SNP rs2045517. The right y-axis shows the proportion of the gene expression variance explained by the SNP (black bar). Each panel represents a different cohort: Laval (n = 407), UBC (n = 287), Groningen (n = 342). The eQTL p values were 4.1×10⁻⁵, 0.009 and 0.218, respectively.
Figure 5
Figure 5. Lung eQTLs on 4q31 in the Laval dataset.
Each dot represents an association test between one SNP and one probeset. Only dots above the red line are significant (p<1.5×10⁻⁵). Significant SNPs were regulating the expression levels of BC029578 in green, FREM3 in purple, HHIP in blue, and OTUD4 in red. The SNP with the smaller p-value is indicated. SNPs previously associated with COPD are presented at the bottom.
Figure 6
Figure 6. Boxplots of gene expression levels in the lung for BC029578 according to genotype groups for SNP rs7667092.
The left y-axis shows the mRNA expression levels for BC029578. The x-axis represents the three genotype groups for SNP rs7667092. The right y-axis shows the proportion of the gene expression variance explained by the SNP (black bar). Each panel represents a different cohort: Laval (n = 406), UBC (n = 287), Groningen (n = 342). The eQTL p-values were 1.8×10⁻⁸, 7.3×10⁻¹⁰ and 6.0×10⁻¹¹, respectively.
Figure 7
Figure 7. Boxplots of gene expression levels in the lung for HHIP according to genotype groups for SNP rs1828591.
The left y-axis shows the mRNA expression levels for HHIP. The x-axis represents the three genotype groups for SNP rs1828591. The right y-axis shows the proportion of the gene expression variance explained by the SNP (black bar). Each panel represents a different cohort: Laval (n = 407), UBC (n = 287), Groningen (n = 342). The eQTL p-values were 6.7×10⁻⁷, 0.013 and 0.214, respectively.
Figure 8
Figure 8. Lung eQTLs on 19q13 in the Laval dataset.
Each dot represents an association test between one SNP and one probeset. Only dots above the red line are significant (p<7.1×10⁻⁷). Significant SNPs were regulating the expression levels of ZNF780A in brown, SERTAD3 in light blue, NUMBL in orange, EGLN2 in dark green, CYP2G1P in dark grey, AXL in yellow, B3GNT8 in blue, LOC100505495 in red, CEACAM21 in green, and CEACAM4 in purple. The SNP with the smaller p-value is indicated. SNPs previously associated with COPD are illustrated at the bottom.
Figure 9
Figure 9. Boxplots of gene expression levels in the lung for EGLN2 according to genotype groups for SNP rs4803369.
The left y-axis shows the mRNA expression levels for EGLN2. The x-axis represents the three genotype groups for SNP rs4803369. The right y-axis shows the proportion of the gene expression variance explained by the SNP (black bar). Each panel represents a different cohort: Laval (n = 406), UBC (n = 287), Groningen (n = 342). The eQTL p values were 8.9×10⁻⁷, 0.001 and 0.003, respectively.

References

    1. World Health Organization (2008) World Health Statistics 2008. Available: http://www.who.int/whosis/whostat/2008/en/. Accessed 2012 Nov 12.
    1. Rabe KF, Hurd S, Anzueto A, Barnes PJ, Buist SA, et al. (2007) Global strategy for the diagnosis, management, and prevention of chronic obstructive pulmonary disease: GOLD executive summary. Am J Respir Crit Care Med 176: 532–555. - PubMed
    1. Mannino DM, Homa DM, Akinbami LJ, Ford ES, Redd SC (2002) Chronic obstructive pulmonary disease surveillance–United States, 1971–2000. Respir Care 47: 1184–1199. - PubMed
    1. Kueppers F, Miller RD, Gordon H, Hepper NG, Offord K (1977) Familial prevalence of chronic obstructive pulmonary disease in a matched pair study. Am J Med 63: 336–342. - PubMed
    1. Ganrot PO, Laurell CB, Eriksson S (1967) Obstructive lung disease and trypsin inhibitors in alpha-1-antitrypsin deficiency. Scand J Clin Lab Invest 19: 205–208. - PubMed

Publication types