. 2013 Aug 1;8(8):e66319.
doi: 10.1371/journal.pone.0066319. Print 2013.

Depth sensitivity and source-detector separations for near infrared spectroscopy based on the Colin27 brain template

Affiliations

Depth sensitivity and source-detector separations for near infrared spectroscopy based on the Colin27 brain template

Gary E Strangman et al. PLoS One. .

Abstract

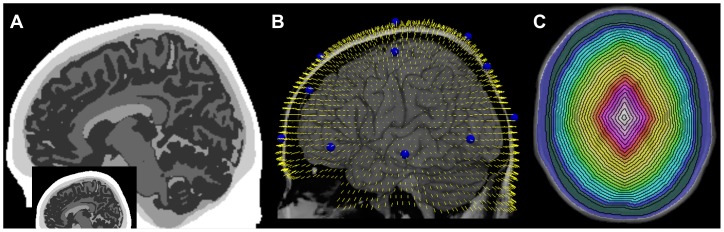
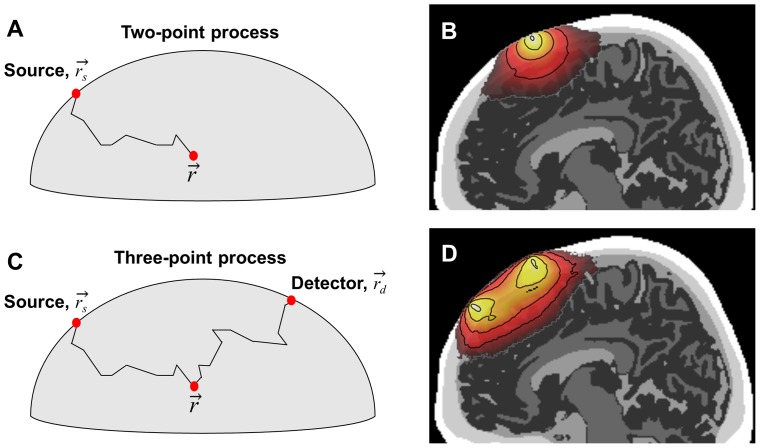
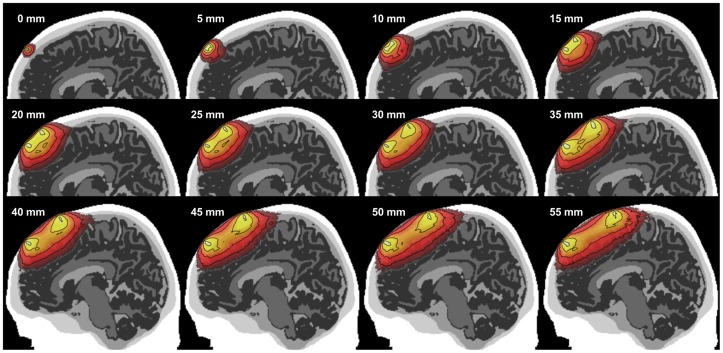
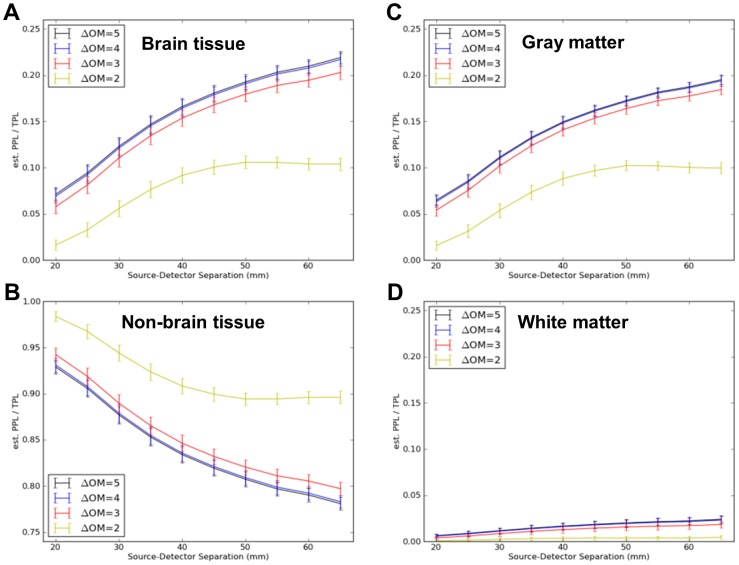
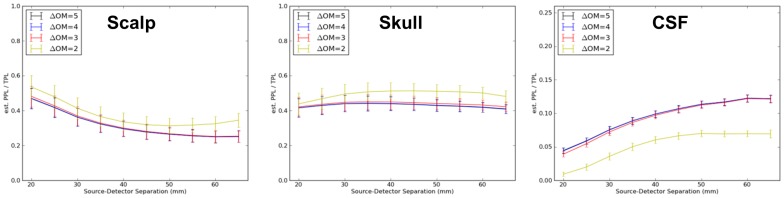
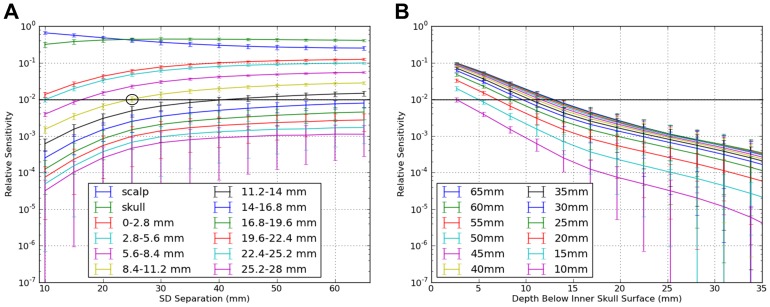
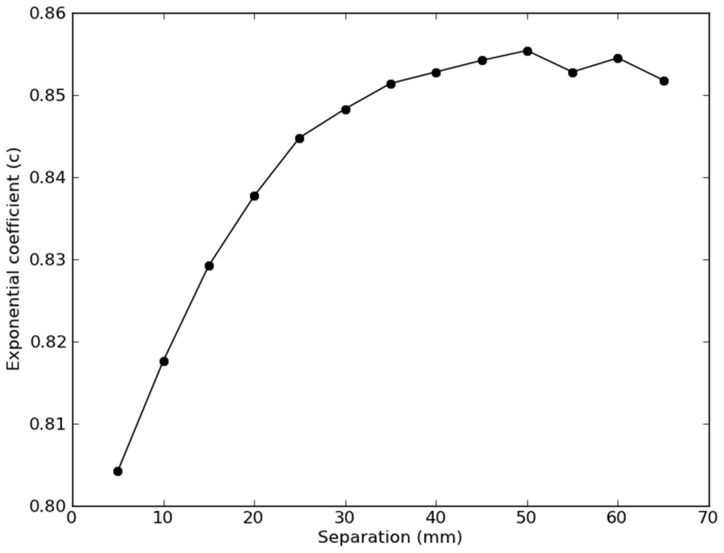
Understanding the spatial and depth sensitivity of non-invasive near-infrared spectroscopy (NIRS) measurements to brain tissue-i.e., near-infrared neuromonitoring (NIN) - is essential for designing experiments as well as interpreting research findings. However, a thorough characterization of such sensitivity in realistic head models has remained unavailable. In this study, we conducted 3,555 Monte Carlo (MC) simulations to densely cover the scalp of a well-characterized, adult male template brain (Colin27). We sought to evaluate: (i) the spatial sensitivity profile of NIRS to brain tissue as a function of source-detector separation, (ii) the NIRS sensitivity to brain tissue as a function of depth in this realistic and complex head model, and (iii) the effect of NIRS instrument sensitivity on detecting brain activation. We found that increasing the source-detector (SD) separation from 20 to 65 mm provides monotonic increases in sensitivity to brain tissue. For every 10 mm increase in SD separation (up to ~45 mm), sensitivity to gray matter increased an additional 4%. Our analyses also demonstrate that sensitivity in depth (S) decreases exponentially, with a "rule-of-thumb" formula S=0.75*0.85(depth). Thus, while the depth sensitivity of NIRS is not strictly limited, NIN signals in adult humans are strongly biased towards the outermost 10-15 mm of intracranial space. These general results, along with the detailed quantitation of sensitivity estimates around the head, can provide detailed guidance for interpreting the likely sources of NIRS signals, as well as help NIRS investigators design and plan better NIRS experiments, head probes and instruments.


Conflict of interest statement

Competing Interests: The authors have declared that no competing interests exist.

Figures

Figure 1
Figure 1. Anatomy used for Monte Carlo simulations and processing.
(A) Sagittal section (MNIx = −9 mm) through the segmented Colin27 head. Shades from white to dark gray are: scalp, skull, cerebrospinal fluid, white and gray matter, respectively. The inset shows the original, pre-eroded scalp on the same slice. (B) Location and orientation of the 3,555 photon injection points around the Colin27 scalp used for the Monte Carlo simulations. The injection vectors (yellow) are shown in relation to the scalp profile and underlying cortical surface (rendered brain). The nineteen standard locations in the International 10–20 System are highlighted in blue. (C) Colorized shells representing the masks used for depth sensitivity analysis (blue = scalp, green = skull, dark blue to pink = twenty-one ∼2.8 mm thick shells).
Figure 2
Figure 2. Photon propagation through scattering tissue.
(A) Representation of a single photon moving through tissue, from the source, to an arbitrary point inside the medium. Accumulation of photon weights during this process is the basis of a 2-point Green's function. (B) Example 2-point Green's function, with colors representing the intensity of light reaching any given point in the tissue (truncated after a 5 order-of-magnitude reduction in intensity from peak). (C) Representation of a single photon traveling from the source, to a point in the medium, and on to a detector; the basis of a 3-point sensitivity function. (D) Example 3-point sensitivity function generated from two MC simulations (one for the source, one for the detector) spaced 30 mm apart.
Figure 3
Figure 3. Photon sensitivity profile at a broad range of source-detector separations.
Contours are drawn for each order of magnitude loss in sensitivity from peak and are truncated after 5 orders of magnitude.
Figure 4
Figure 4. Mean proportion of total sensitivity to the tissue types indicated as a function of source-detector separation.
Errorbars represent standard errors across all nineteen locations in the International 10–20 System. Separate curves represent pre-thresholding of the sensitivity (3-point Green's function) maps at 5, 4, 3, or 2 orders of magnitude (OM) reduction in sensitivity compared to peak, representing progressively less optimal NIRS measurement systems. (A) Sensitivity to brain tissue = gray plus white matter. (B) Non-brain tissue = CSF plus skull plus scalp. (C) Gray matter only. (D) White matter only.
Figure 5
Figure 5. Mean proportion of total sensitivity to scalp, skull, and CSF as a function of source-detector separation.
Errorbars represent standard errors across all nineteen locations in the International 10–20 System. Separate curves again represent pre-thresholding of the sensitivity (3-point Green's function) maps at 5, 4, 3 or 2 orders of magnitude (OM) reduction in sensitivity compared to peak.
Figure 6
Figure 6. Mean NIRS depth sensitivity in the brain plotted in two orthogonal ways, by SD separation.
(A) The top two traces represent scalp (blue) and skull (green) sensitivity. Sensitivity to scalp and skull were equal at a SD separation of 25 mm. On average, 1% or more of the sensitivity profile was achieved for all of the most superficial 11.2 mm of the intracranial volume at SD separations of 25 mm or greater (circle). (B) Intracranial sensitivity in depth as a function of source-detector separation (excluding scalp and skull). At all separations, sensitivity decreases exponentially with depth (i.e., linear curves through ∼15 mm depth on this semilog plot).
Figure 7
Figure 7. Fitted exponential decay coefficient, c, from the sensitivity function in Eqn. (6) as a function of SD separation.
The asymptote at ∼40 mm separations means that further increasing the SD separation provides diminishing returns for NIRS sensitivity to brain function.

References

    1. Villringer A, Chance B (1997) Non-invasive optical spectroscopy and imaging of human brain function. Trends Neurosci 20: 435–442. - PubMed
    1. Strangman G, Boas DA, Sutton JP (2002) Non-invasive neuroimaging using near-infrared light. Biol Psychiatry 52: 679–693. - PubMed
    1. Ferrari M, Mottola L, Quaresima V (2004) Principles, techniques, and limitations of near infrared spectroscopy. Can J Appl Physiol 29: 463–487. - PubMed
    1. Pogue BW, Patterson MS (1994) Frequency-domain optical absorption spectroscopy of finite tissue volumes using diffusion theory. Physics in medicine and biology 39: 25. - PubMed
    1. Moulton JD (1990) Diffusion modelling of picosecond laser pulse propagation in turbid media: McMaster University.

Publication types