. 2013 Aug 1;8(8):e69879.
doi: 10.1371/journal.pone.0069879. Print 2013.

Production and characterization of novel recombinant adeno-associated virus replicative-form genomes: a eukaryotic source of DNA for gene transfer

Affiliations

Production and characterization of novel recombinant adeno-associated virus replicative-form genomes: a eukaryotic source of DNA for gene transfer

Lina Li et al. PLoS One. .

Abstract

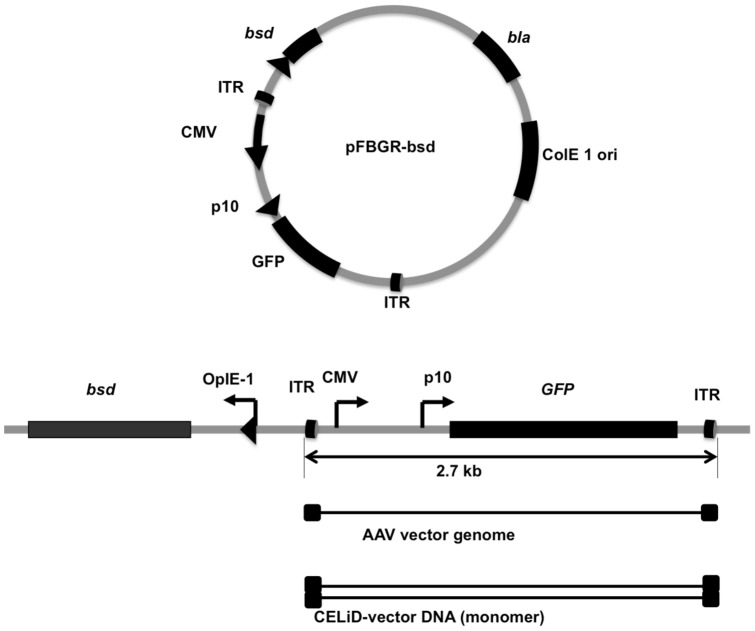
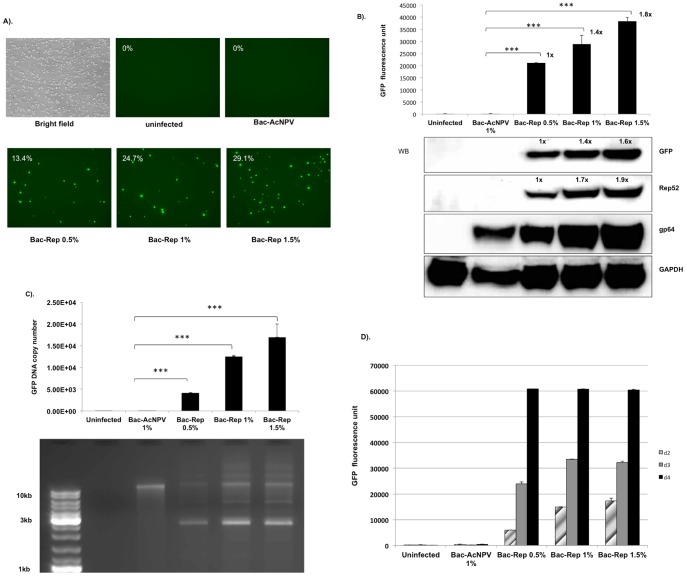
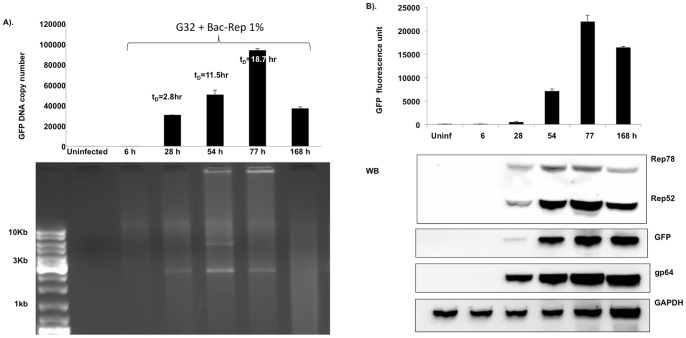
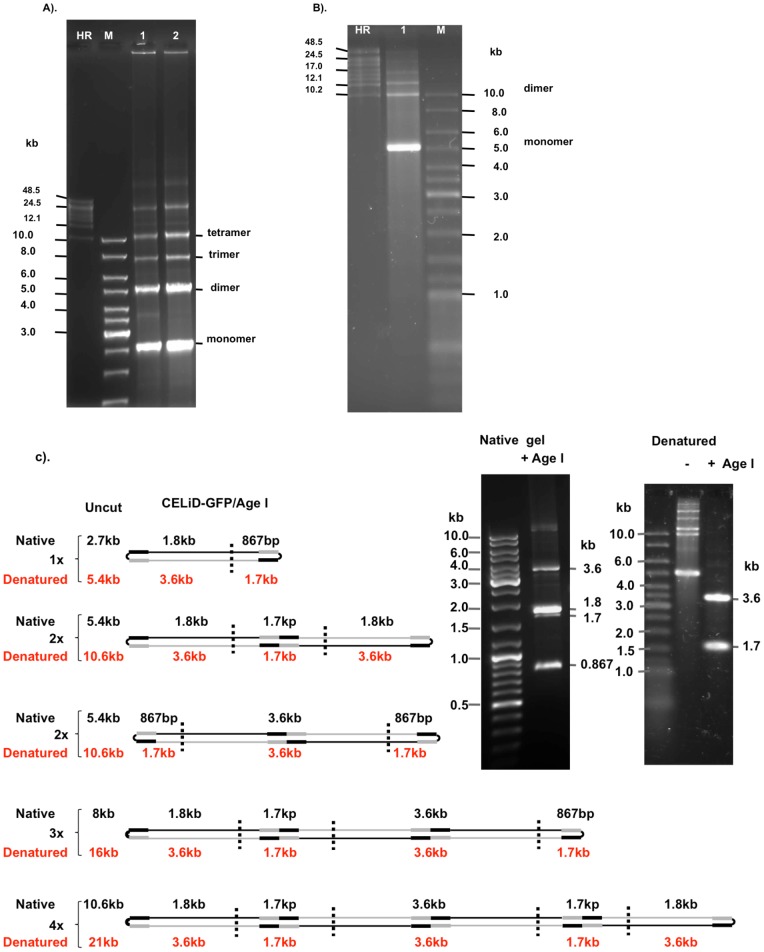
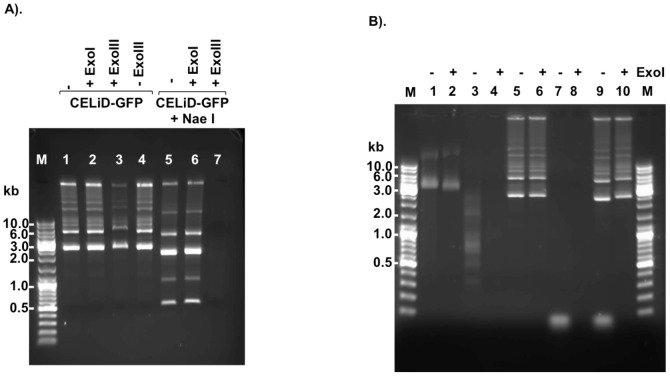
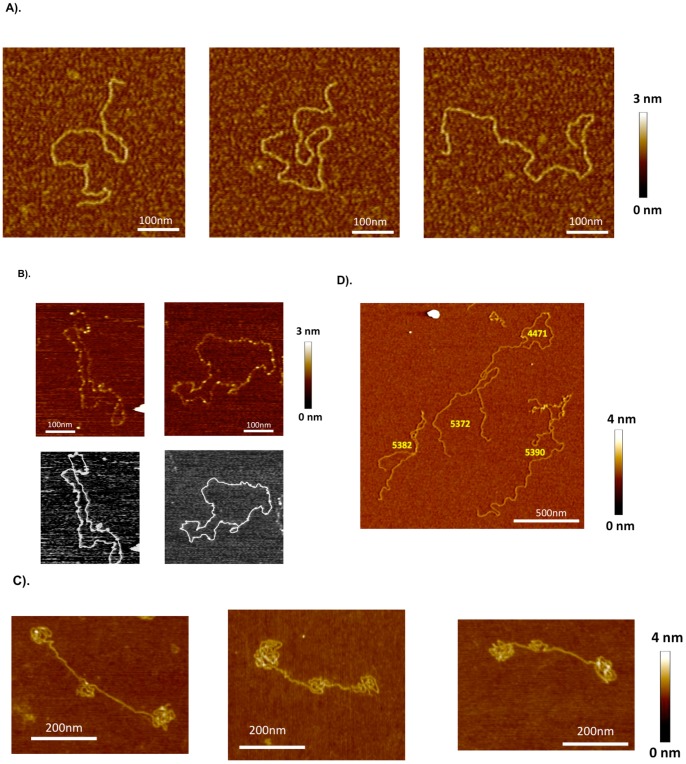
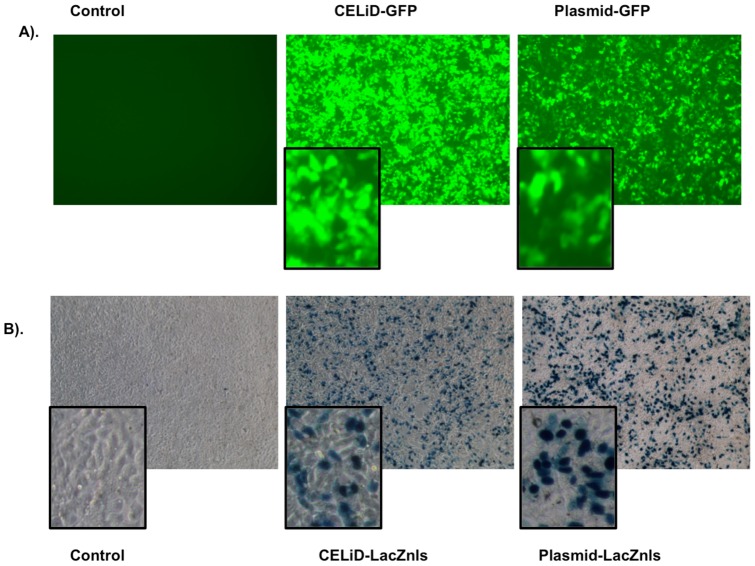
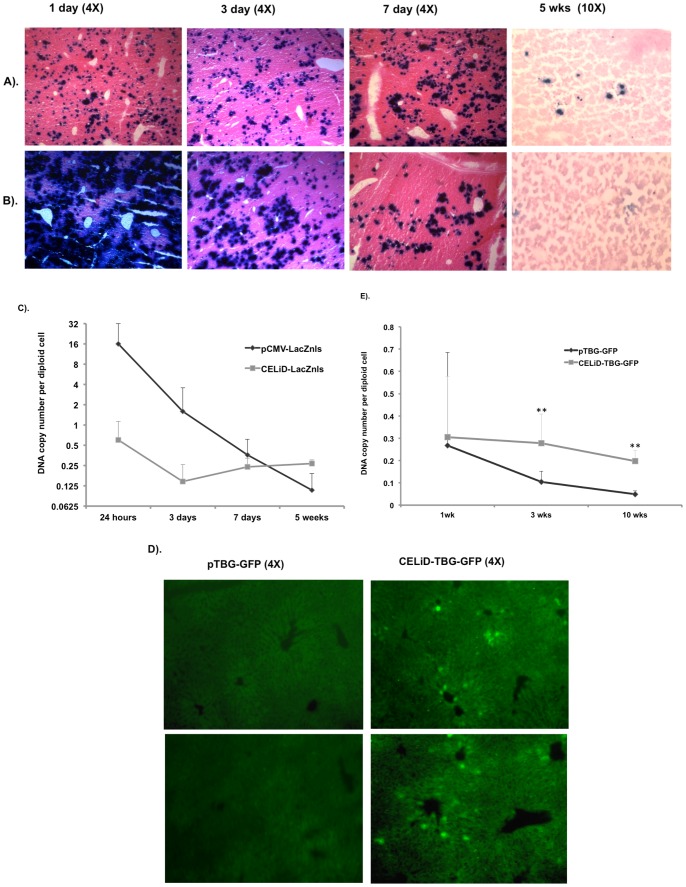
Conventional non-viral gene transfer uses bacterial plasmid DNA containing antibiotic resistance genes, cis-acting bacterial sequence elements, and prokaryotic methylation patterns that may adversely affect transgene expression and vector stability in vivo. Here, we describe novel replicative forms of a eukaryotic vector DNA that consist solely of an expression cassette flanked by adeno-associated virus (AAV) inverted terminal repeats. Extensive structural analyses revealed that this AAV-derived vector DNA consists of linear, duplex molecules with covalently closed ends (termed closed-ended, linear duplex, or "CELiD", DNA). CELiD vectors, produced in Sf9 insect cells, require AAV rep gene expression for amplification. Amounts of CELiD DNA produced from insect cell lines stably transfected with an ITR-flanked transgene exceeded 60 mg per 5 × 10(9) Sf9 cells, and 1-15 mg from a comparable number of parental Sf9 cells in which the transgene was introduced via recombinant baculovirus infection. In mice, systemically delivered CELiD DNA resulted in long-term, stable transgene expression in the liver. CELiD vectors represent a novel eukaryotic alternative to bacterial plasmid DNA.


Conflict of interest statement

Competing Interests: The authors have declared that no competing interests exist.

Figures

Figure 1
Figure 1. Schematic representation of plasmid DNA used for producing stable cell lines.
Plasmid pFBGR-bsd contains the GFP gene under the dual control of the cytomegalovirus IE promoter (CMV) and baculovirus p10 promoter (p10) flanked by AAV-2 inverted terminal repeats (ITR). bla, β-lactamase (ampicillicin-resistance gene). bsd, blasticidin-S deaminase gene. ColE1, bacterial origin of replication. (Lower) Linear illustration of pFBGR-bsd indicates the rescued forms of the ITR-flanked transgene. The linear, single-stranded AAV virion genome is represented by a solid thin line flanked by the inverted terminal repeats (ITRs, filled rectangles). The duplex CELiD-vector DNA is represented by the open rectangle flanked by AAV ITRs.
Figure 2
Figure 2. AAV Rep protein-dependent expression of GFP.
(A) Induction of GFP expression in blasticidin-S resistant Sf9/ITR-GFP cells in response to Bac-Rep infection. The clonal Sf9/ITR-GFP cell line contains a stably integrated copy of pFBGR-bsd. Uninfected cells or cells infected with wild-type baculovirus (Bac-AcNPV) lack detectable GFP expression as determined by FACS analysis. (upper row, 0% GFP positive cells). Addition of Bac-Rep inoculum (0.5%, 1.0%, and 1.5%; v:v) resulted in a dose-dependent increase in the number of GFP-positive cells (lower row). Images were obtained 3 days after infection. Magnification, 10x objective used for all images. (B) Quantitative analysis of GFP induction as a function of Bac-Rep dose. Cells exposed to increasing doses of Bac-Rep were harvested on day 3 post-infection. Fluorescent emission intensities were assessed from equivalent amounts of cell lysates (80 µg protein), using the fluorescent reader function of a real-time thermocycler (excitation 450–490 nm; emission 515–530 nm) (upper panel), *** indicates t-test significance (p<0.001). The relative fold-increase in GFP fluorescence is indicated by the values next to each bar. Protein concentrations were determined in the lysates and approximately 120 µg of each sample was fractionated electrophoretically using SDS-polyacrylamide gels. Proteins were electroblotted onto nitrocellulose membranes for western blot detection of GFP, Rep52, gp64, and GAPDH (used as a protein loading and transfer standard, lower panel). Relative levels of protein are indicated by the values above the protein band. (C) Analysis of the increase of GFP-vector DNA in response to Bac-Rep infection. Low molecular weight DNA was recovered from the cells and the quantity of GFP vector genomes determined using real-time qPCR (upper panel). Both the uninfected cell control and the wild-type baculovirus-infected cell control lysates produced a relatively low PCR signal (150 and 175 copies per cell, respectively). The GFP vector DNA copy number increased to 21087 copies per cell with 0.5% (v:v) Bac-Rep. At 1% (v:v) Bac-Rep, the copy number increased to 28862 copies per cell and 1.5% (v:v) Bac-Rep increased the copy number to 38286 per cell. The statistical significance was determined by Student's t-test. ***, p<0.001. Lower panel – The samples were analyzed by agarose-ethidium bromide gel electrophoresis (1% agarose). No detectable CELiD DNA was recovered from uninfected cells. A band >10 kb appears in lysates from all baculovirus-infected cells. (D) Time-course of GFP fluorescence. Sf9/ITR-GFP cells were inoculated with either wtBac (Bac-ACNPV) or Bac-Rep (0.5%, 1%, and 1.5% (v:v)). GFP fluorescence was measured for the indicated cellular lysate at 1, 2, and 3 days post-infection.
Figure 3
Figure 3. Rate of GFP vector DNA accumulation.
(A). Cells were inoculated with 1% (v:v) Bac-Rep stock and sampled at 6, 28, 54, 77, and 168 hr post-infection. The GFP-vector DNA content was determined by qPCR (upper panel). The doubling time of the GFP vector DNA was determined using the following algorithm: tD  =  (t2–t1) log 2/log (t2/t1), where tD is the doubling time and tn is the GFP copy number at a given time point. The tD (28 hr)  = 2.8 hr, tD (54 hr)  = 11.5 hr, and tD (77 hr)  = 18.7 hr. (B) Time course of protein expression in Sf9/ITR-GFP cells. GFP fluorescence was measured in cell lysates obtained from the time-course described in (A) (upper panel). Aliquots from each time point were fractionated on SDS-polyacrylamide gels and transferred to nitrocellulose membranes for western blot analysis to detect Rep proteins, GFP proteins, gp64, and GAPDH (used as a loading and transfer control).
Figure 4
Figure 4. Native and denaturing agarose gel electrophoresis of CELiD-GFP DNA.
(A) Native agarose gel electrophoresis (0.4% agarose, 1x TAE buffer). CELiD DNA resolved as a 2.7 kb monomer and associated multimeric concatomers. Lane 1: CELiD-GFP DNA produced from co-infecting parental Sf9 cells with Bac-Rep and a baculovirus bearing an AAV ITR-flanked GFP cassette, Bac-GFP. Lane 2: CELiD-GFP DNA produced from an Sf9/ITR-GFP cell line bearing a stably integrated AAV GFP vector genome. M: 1 kb DNA ladder. HR: high-range DNA ladder. The positions of various replicative-form CELiD DNAs are indicated: monomer, dimer, trimer, and tetramer. (B) Denaturing agarose gel electrophoresis (0.7% alkaline agarose). CELiD-GFP DNA conformers appear predominantly as a 5.4 kb band, with dimer and higher order forms detectable. (C) Restriction map. Restriction endonuclease AgeI has one recognition site in the CELiD monomer, generating two fragments of 1801 bp and 867 bp, respectively. Schematic representation of the AgeI recognition site(s) in the monomer (1x), dimer (2x) and multimer (3x and 4x) forms of CELiD-GFP DNA. CELiD-GFP monomer: 2668 bp. The black rectangles indicate the positions of the AAV 5′ ITRs, and the gray rectangles indicate the positions of the AAV 3′ ITRs. The two dimer figures represent tail-to-tail and head-to-head configurations. The predicted DNA length and fragments are indicated. Top right, images of native (1% agarose, TBE buffer) and denaturing (0.7% agarose, alkaline buffer) agarose gel electrophoresis of AgeI-digested CELiD-GFP DNA. “−” indicates uncut CELiD-GFP DNA, “+” indicates AgeI-digested DNA.
Figure 5
Figure 5. CELiD-GFP DNA sensitivity to exonuclease I and exonuclease III.
E. coli exonuclease III (ExoIII) removes nucleotides processively (3′ –>5′) from DNA initiating at a 3′-OH of either blunt-ended or 5′ protruding duplex DNA. E. coli exonuclease I (ExoI) degrades single-stranded DNA processively in a 3′ to 5′ direction. (A) Total CELiD DNA (1 µg) was incubated with either ExoI (20 units) or ExoIII (100 units), either without prior restriction enzyme (RE) digestion (left) or following RE digestion (right). Lane M: DNA size ladder. Lane 1: untreated CELiD DNA. Lane 2: CELiD DNA treated with ExoI. Lane 3: CELiD DNA treated with ExoIII. Lane 4: untreated CELiD DNA. Samples in lanes 5, 6, 7 were digested with NaeI prior to exonuclease treatment. Lane 5: no exonuclease control. Lane 6: ExoI treatment. Lane7: ExoIII treatment. (B) Additional substrates as controls for ExoI activity. The φX174 virus genome is a 5386 nt, single-stranded, closed circular DNA molecule. ExoI treatment is indicated above each lane by a “+” or “–” sign. Lanes 1 and 2: φX174 DNA. Lanes 3 and 4: φX174 DNA digested with HaeIII. Lanes 5 and 6: CELiD DNA. Lanes 7 and 8: single-stranded synthetic oligonucleotide (25mer). Lanes 9 and 10: Mixed CELiD DNA and 25mer.
Figure 6
Figure 6. AFM images of CELiD vector DNA chains adsorbed onto APS-treated mica.
(A) Typical images of the CELiD-GFP monomer deposited from aqueous solution (dH2O). The monomer is indistinguishable from standard double-stranded, linear DNA. All images are 450×450 nm. (B) CELiD-GFP monomers adsorbed onto mica substrate immediately after being exposed to denaturing conditions. The height of the chain is about half that of the native monomer chain confirming that the loops are single-stranded. These monomers are closed loops with randomly located, condensed regions (brighter spots along the loops). The lengths of these loops are consistent with denatured monomers supporting the model of a covalently closed, duplex conformation under native conditions. Top images are of the denatured monomers. Bottom images show the corresponding traced loops. (C) Images of individual CELiD-GFP dimers adsorbed from H2O. The chains are double-stranded, linear DNA with lengths twice that of the monomer and exhibit a characteristic conformation with three condensed regions, one located centrally and the other two at opposite ends of the molecule. (D) Under high salt conditions (0.5 M NaCl), the condensed regions of the CELiD-GFP dimer relax and the chains take on conformations typical of double-stranded, linear DNA with length twice that of the monomer CELiD vector DNA. Numbers in yellow indicate the chain length in bp, estimated by path tracing.
Figure 7
Figure 7. CELiD vector DNA expression in vitro.
(A) HEK 293 cells transiently transfected with CELiD-GFP DNA or plasmid pFBGR for green fluorescent protein (GFP) expression. Both DNAs harbor an identical gene expression cassette encoding GFP and were transfected using equivalent copy numbers. Images were taken at day 6 post-transfection. Magnification, 10x objective (with digitally-enlarged insert). (B) HEK 293 cells transiently transfected with equal amounts of CELiD-LacZnls DNA or plasmid pFB-CMV-LacZnls. Both DNAs harbor an identical gene expression cassette encoding β-galactosidase with a nuclear localization signal (LacZnls). X-gal staining of cells at three days post-transfection. Magnification, 10x objective (with digitally-enlarged insert).
Figure 8
Figure 8. In vivo gene expression and DNA copy number per diploid cell following tail vein injection of (A) CELiD-LacZnls or (B) Plasmid-LacZnls (pCMV-LacZnls).
1 µg of CELiD DNA or 10 µg of the circular plasmid DNA was administrated by hydrodynamic tail vein injection. Transfected livers were harvested and processed at days 1, 3, and 7, as well as 5 weeks post-injection. Histological samples were sectioned and stained to detect β-galactosidase activity (indicated by dark blue nuclei). Samples were counterstained with eosin. (C) CELiD-LacZnls and plasmid-LacZnls copy number per diploid cell in transfected livers. The DNA copy number was normalized based on the PCR quantification of the endogenous mouse glucagon gene, n = 3 to 4. (D) Comparative long-term transgene expression from constructs bearing a liver specific thyroxine-binding globulin (TBG) promoter. CELiD-TBG-GFP or plasmid pTBG-GFP gene expression in liver section 10 weeks post-hydrodynamic tail vein injection. (E) CELiD-TBG-GFP and plasmid pTBG-GFP DNA copy number per diploid cell in transfected livers. The same amount of DNA (10 µg) was administrated by hydrodynamic injection. Statistical analysis by TTEST. ** indicates P<0.01.

References

    1. Wicks IP, Howell ML, Hancock T, Kohsaka H, Olee T, et al. (1995) Bacterial lipopolysaccharide copurifies with plasmid DNA: implications for animal models and human gene therapy. Human Gene Therapy 6: 317–323. - PubMed
    1. Bessis N, GarciaCozar FJ, Boissier MC (2004) Immune responses to gene therapy vectors: influence on vector function and effector mechanisms. Gene Therapy 11 Suppl 1S10–17. - PubMed
    1. Sawamura D, Abe R, Goto M, Akiyama M, Hemmi H, et al. (2005) Direct injection of plasmid DNA into the skin induces dermatitis by activation of monocytes through toll-like receptor 9. Journal of Gene Medicine 7: 664–671. - PubMed
    1. Wooddell CI, Subbotin VM, Sebestyen MG, Griffin JB, Zhang G, et al. (2011) Muscle damage after delivery of naked plasmid DNA into skeletal muscles is batch dependent. Human Gene Therapy 22: 225–235. - PubMed
    1. Urabe M, Ding C, Kotin RM (2002) Insect cells as a factory to produce adeno-associated virus type 2 vectors. Human Gene Therapy 13: 1935–1943. - PubMed

Publication types