Comparative Study
. 2013 Aug 2;8(8):e70174.
doi: 10.1371/journal.pone.0070174. Print 2013.

A possible mechanism behind autoimmune disorders discovered by genome-wide linkage and association analysis in celiac disease

Affiliations
Comparative Study

A possible mechanism behind autoimmune disorders discovered by genome-wide linkage and association analysis in celiac disease

Malin Östensson et al. PLoS One. .

Abstract

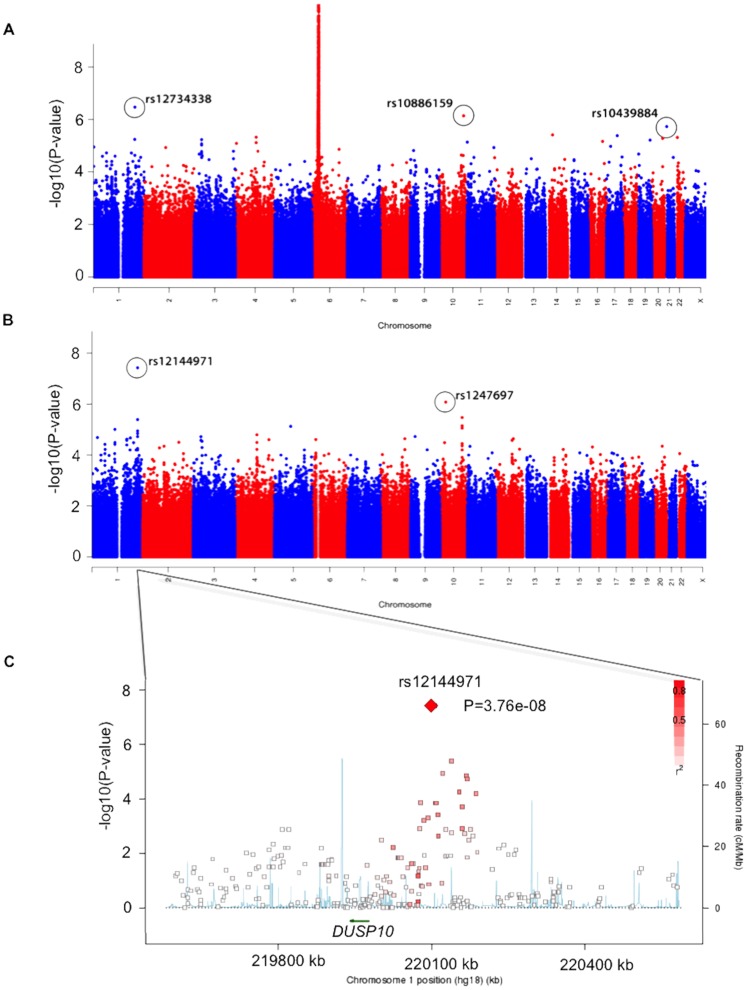
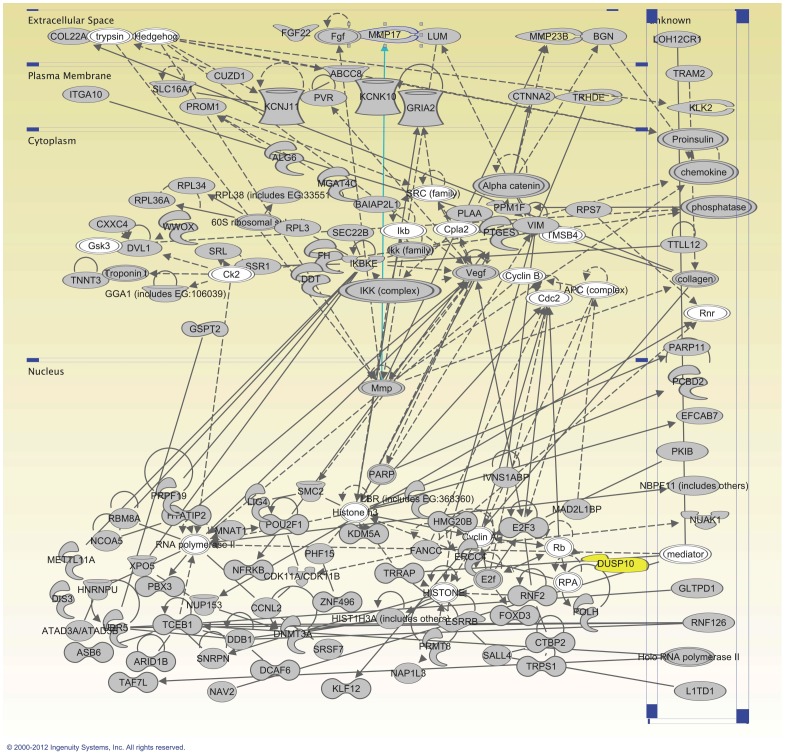
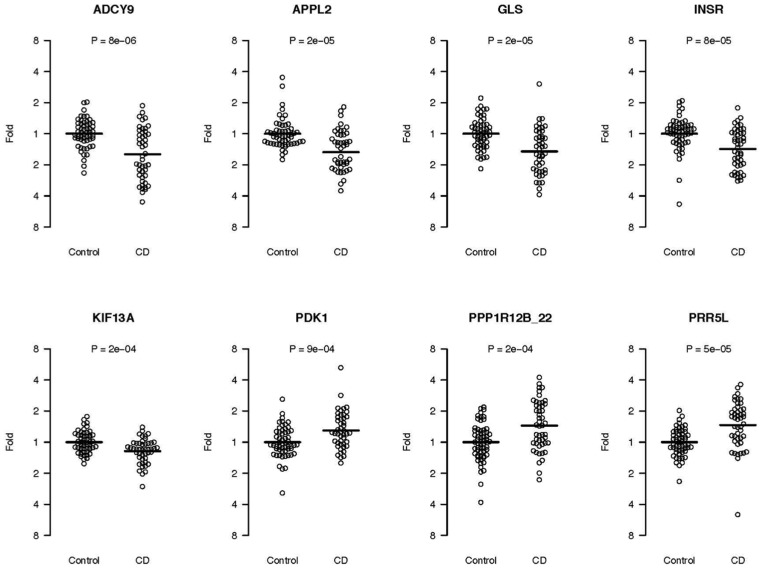
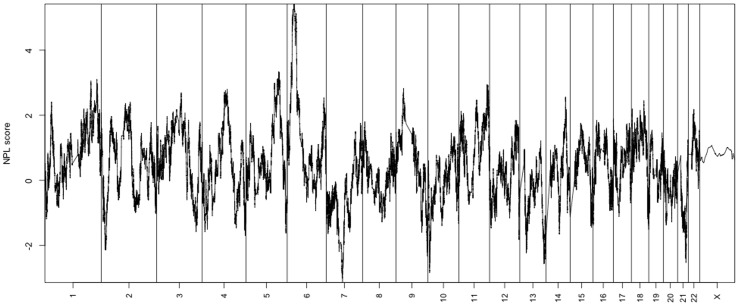
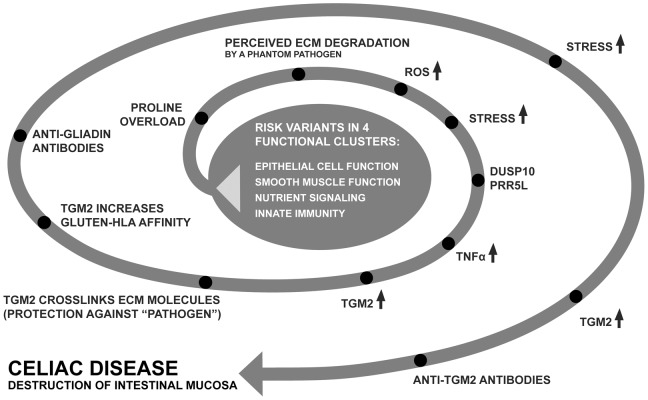
Celiac disease is a common autoimmune disorder characterized by an intestinal inflammation triggered by gluten, a storage protein found in wheat, rye and barley. Similar to other autoimmune diseases such as type 1 diabetes, psoriasis and rheumatoid arthritis, celiac disease is the result of an immune response to self-antigens leading to tissue destruction and production of autoantibodies. Common diseases like celiac disease have a complex pattern of inheritance with inputs from both environmental as well as additive and non-additive genetic factors. In the past few years, Genome Wide Association Studies (GWAS) have been successful in finding genetic risk variants behind many common diseases and traits. To complement and add to the previous findings, we performed a GWAS including 206 trios from 97 nuclear Swedish and Norwegian families affected with celiac disease. By stratifying for HLA-DQ, we identified a new genome-wide significant risk locus covering the DUSP10 gene. To further investigate the associations from the GWAS we performed pathway analyses and two-locus interaction analyses. These analyses showed an over-representation of genes involved in type 2 diabetes and identified a set of candidate mechanisms and genes of which some were selected for mRNA expression analysis using small intestinal biopsies from 98 patients. Several genes were expressed differently in the small intestinal mucosa from patients with celiac autoimmunity compared to intestinal mucosa from control patients. From top-scoring regions we identified susceptibility genes in several categories: 1) polarity and epithelial cell functionality; 2) intestinal smooth muscle; 3) growth and energy homeostasis, including proline and glutamine metabolism; and finally 4) innate and adaptive immune system. These genes and pathways, including specific functions of DUSP10, together reveal a new potential biological mechanism that could influence the genesis of celiac disease, and possibly also other chronic disorders with an inflammatory component.


Conflict of interest statement

Competing Interests: The authors have declared that no competing interests exist.

Figures

Figure 1
Figure 1. Manhattanplot of the TDT p-values.
a) The location of all genotyped SNPs on chromosomes 1–22 and X plotted on the x-axis. –log10(p-value) result for each SNP and all transmissions on the y-axis. b) The location of all genotyped SNPs on chromosomes 1–22 and X plotted on the x-axis. –log10(p-value) result for each SNP and all transmissions, to children in the low risk group, on the y-axis. c) Regional plot of association results and recombination rates, within the region surrounding DUSP10, generated by SNAP (http://www.broadinstitute.org/mpg/snap/ldplot.php). The x-axis show 500 kb around the most associated SNP. Genomic locations of genes within the region of interest (NCBI Build 36 human assembly) were annotated from the UCSC Genome Browser (arrows). The left y-axis show –log10(p-value) and estimated recombination rates (cM/Mb) from HapMap Project (NCBI Build 36) are shown in light blue lines.
Figure 2
Figure 2. Illustration of the three inclusion criteria used for pathway and interaction analyses.
The first criteria of p-values less than 3.0×10⁻⁴ in the linkage TDT analysis resulted in a total of 477 markers. The second criteria included a comparison of the results from this study with the results from the study by Dubois et al. . We included 118 SNPs that had a simple score based on a combined p-value less than 5.0×10⁻⁵ and in the same allelic direction in both datasets. The third criteria involved selecting markers with a large effect size. We included 65 markers which had a ratio of transmitted versus not transmitted (T/NT) alleles of over 5 or below 0.2, combined with a p-value of less than 2.0×10⁻³.
Figure 3
Figure 3. Ingenuity network 1.
The top network identified by the Ingenuity IPA software using genes surrounding all 603 most associated SNPs from the TDT analysis. Molecules in gray were present among the genes from our TDT analysis and molecules in white were added by the IPA software. The DUSP10 gene is marked in yellow.
Figure 4
Figure 4. Gene expression results.
Fold change on the y-axis is plotted for each individual in the two groups, 46 CD cases and 52 control patients. Each circle in the graph represents an individual. The mean expression value of the control group is set to 1.
Figure 5
Figure 5. NPL results.
Non-Parametric Linkage score displayed as –log10(p-value) on the y-axis and chromosome 1–22 and X on the x-axis.
Figure 6
Figure 6. Proposed disease model.
Illustrating a possible scenario for disease development. Genetic variation contributing susceptibility to disease can be found in at least four, somewhat overlapping, biological functions. The result is an “overload” or imbalance of proline vs glutamine. Due to the abundance of proline within the extracellular matrix (ECM) as well as in gluten, the proline from gluten is interpreted as degradation of ECM. When the body is not starving, the ECM is normally not degraded, unless there is a pathogen attempting to break through this barrier. The immune system mounts an attack against an invasive “phantom pathogen” which is believed to degrade the ECM. When proline is catabolized, reactive oxygen species (ROS) are released. In order to start re-building and crosslinking ECM molecules, Tissue transglutaminase (TGM2) expression is up-regulated by TNFα which in turn is stimulated by DUSP10 and Protor-2 (PRR5L). This rebuilding of the ECM counteracts the degradation by the imagined pathogen. However, the phantom pathogen remains and the adaptive immunity is brought in. Searching for antigens, it finds an abundance of TGM2 beside the ECM and forms antibodies against its own soldier. Some susceptibility genes can be found in the center of this model and some can be found within the spiral. Genes like HLADQ and other genes from the adaptive immunity are likely to be found in the spiral.

References

    1. Myleus A, Ivarsson A, Webb C, Danielsson L, Hernell O, et al. (2009) Celiac disease revealed in 3% of Swedish 12-year-olds born during an epidemic. J Pediatr Gastroenterol Nutr 49: 170–176. - PubMed
    1. Sollid LM, Markussen G, Ek J, Gjerde H, Vartdal F, et al. (1989) Evidence for a primary association of celiac disease to a particular HLA-DQ alpha/beta heterodimer. J Exp Med 169: 345–350. - PMC - PubMed
    1. Dubois PC, Trynka G, Franke L, Hunt KA, Romanos J, et al. (2010) Multiple common variants for celiac disease influencing immune gene expression. Nat Genet 42: 295–302. - PMC - PubMed
    1. Festen EA, Goyette P, Green T, Boucher G, Beauchamp C, et al. (2011) A meta-analysis of genome-wide association scans identifies IL18RAP, PTPN2, TAGAP, and PUS10 as shared risk loci for Crohn’s disease and celiac disease. PLoS Genet 7: e1001283. - PMC - PubMed
    1. Hunt KA, Zhernakova A, Turner G, Heap GA, Franke L, et al. (2008) Newly identified genetic risk variants for celiac disease related to the immune response. Nat Genet 40: 395–402. - PMC - PubMed

Publication types

MeSH terms

Substances