. 2013 Aug 1;8(8):e70248.
doi: 10.1371/journal.pone.0070248. Print 2013.

Short term exercise induces PGC-1α, ameliorates inflammation and increases mitochondrial membrane proteins but fails to increase respiratory enzymes in aging diabetic hearts

Affiliations

Short term exercise induces PGC-1α, ameliorates inflammation and increases mitochondrial membrane proteins but fails to increase respiratory enzymes in aging diabetic hearts

Amy Botta et al. PLoS One. .

Abstract

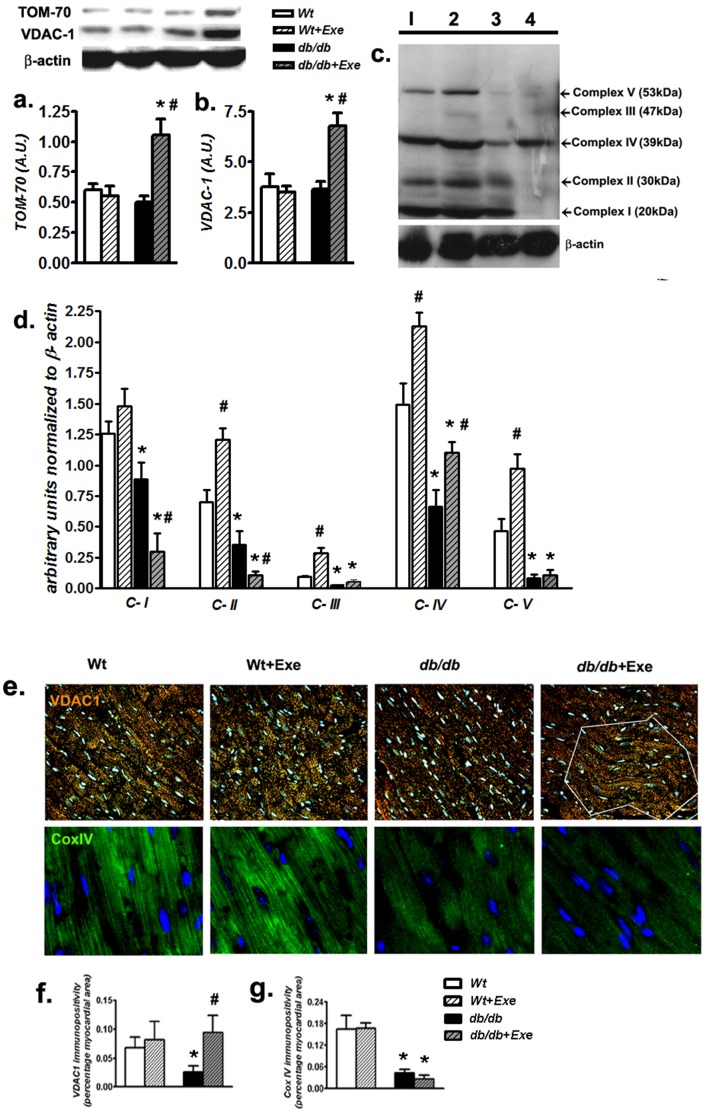
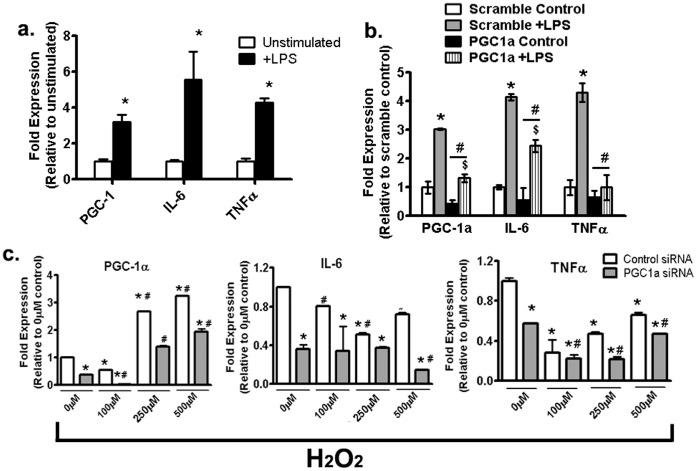
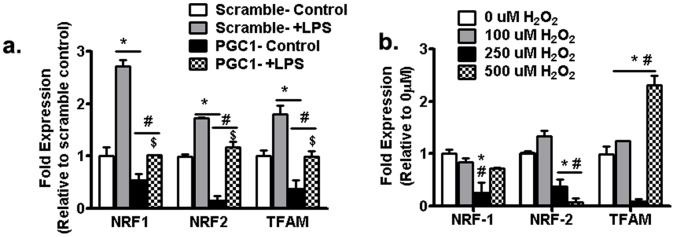
PGC-1α, a transcriptional coactivator, controls inflammation and mitochondrial gene expression in insulin-sensitive tissues following exercise intervention. However, attributing such effects to PGC-1α is counfounded by exercise-induced fluctuations in blood glucose, insulin or bodyweight in diabetic patients. The goal of this study was to investigate the role of PGC-1α on inflammation and mitochondrial protein expressions in aging db/db mice hearts, independent of changes in glycemic parameters. In 8-month-old db/db mice hearts with diabetes lasting over 22 weeks, short-term, moderate-intensity exercise upregulated PGC-1α without altering body weight or glycemic parameters. Nonetheless, such a regimen lowered both cardiac (macrophage infiltration, iNOS and TNFα) and systemic (circulating chemokines and cytokines) inflammation. Curiously, such an anti-inflammatory effect was also linked to attenuated expression of downstream transcription factors of PGC-1α such as NRF-1 and several respiratory genes. Such mismatch between PGC-1α and its downstream targets was associated with elevated mitochondrial membrane proteins like Tom70 but a concurrent reduction in oxidative phosphorylation protein expressions in exercised db/db hearts. As mitochondrial oxidative stress was predominant in these hearts, in support of our in vivo data, increasing concentrations of H2O2 dose-dependently increased PGC-1α expression while inhibiting expression of inflammatory genes and downstream transcription factors in H9c2 cardiomyocytes in vitro. We conclude that short-term exercise-induced oxidative stress may be key in attenuating cardiac inflammatory genes and impairing PGC-1α mediated gene transcription of downstream transcription factors in type 2 diabetic hearts at an advanced age.


Conflict of interest statement

Competing Interests: The authors have declared that no competing interests exist.

Figures

Figure 1
Figure 1. Short-term moderate intensity exercise does not alter body weight or glycemic parameters in aging db/db mice.
(a) Body weight over three weeks of exercise regimen (b) Fasting blood glucose at the end of the exercise regimen (c) Fasting plasma insulin at the end of the exercise regimen. Data was analyzed using two-way ANOVA with Bonferroni tests, p<0.05 (n = 6). *P<0.05 versus corresponding Wt group. Abbreviations:pmol, picomolar, Exe, exercise.
Figure 2
Figure 2. PGC-1α mRNA and protein are upregulated with short term exercise in db/db mice hearts.
PGC-1α mRNA (left panel) and protein (right panel) levels in Wt and db/db mice hearts with or without exercise. Real time PCR analysis of PGC-1α mRNA was normalized to 18S RNA, while PGC-1α protein was normalized against β-actin. Inset: representative bands of PGC-1α and β-actin proteins from the same blot. Data was analyzed using two-way ANOVA with Bonferroni tests, p<0.05 (n = 6). *P<0.05 versus corresponding Wt group; #P<0.05 versus corresponding sedentary group. Abbreviations:PGC-1α, peroxisome proliferator-activated receptor gamma coactivator 1-alpha, Ppargc-1a, gene nomenclature for PGC-1α; A.U., arbirary units.
Figure 3
Figure 3. Induction of PGC-1α is associated with reduction in systemic inflammation in db/db mice.
(a) Circulating proinflammatory cytokines and (b) macrophage/monocyte trafficking chemokines as analyzed in plasma using a multiplex array and quantified in pg/ml. Data was analyzed using two-way ANOVA with Bonferroni tests, p<0.05 (n = 6). *P<0.05 versus corresponding Wt group; #P<0.05 versus corresponding sedentary group. Abbreviations: IL-1α, Interleukin-1 alpha; G-CSF, Granulocyte-colony stimulating factor; IL-6, Interleukin-6; TNF-α, Tumor necrosis factor alpha; CCL2, Chemokine (C-C motif) ligand 2; CXCL2, Chemokine (C-X-C motif) ligand 2; CXCL10, Chemokine (C-X-C motif) ligand 10.
Figure 4
Figure 4. Cardiac inflammation is reduced in db/db mice undergoing short-term, moderate intensity exercise.
(a) Representative micrographs of heart sections probed with rabbit anti-F4/80 Ab for macrophages, stained with Alexafluor594 labeled rabbit secondary Ab and co-stained with DAPI to visualize nuclei. Magnification 200×. Inset: db/db heart sections demonstrating infiltrating macrophages at 630× magnification. (b) Quantification of F4/80+ cells in the ventricle. (c) Real time PCR analysis of the expression of cardiac CD68 and TNF-α normalized to 18S RNA. (d) Western blot analysis of cardiac iNOS to β-actin ratio expressed in arbitrary units. Inset: representative bands of respective proteins from the same blot. (e) Total cardiac nitrate/nitrite levels (NOx ) as measured by using a commercial kit. Data was analyzed using two-way ANOVA with Bonferroni tests, p<0.05 (n = 6). *P<0.05 versus corresponding Wt group; #P<0.05 versus corresponding sedentary group. Abbreviations:TNF-α, Tumor necrosis factor alpha, DAPI, 4′,6-diamidino-2-phenylindole; CD68, Microsialin; iNOS, Inducible nitric oxide synthase; NOx, Nitrate/nitrite, A.U., arbitrary units.
Figure 5
Figure 5. Induction of PGC-1α is associated with an increase in mtDNA density, mitochondrial fission but not downstream transcriptional mediator and respiratory gene expression.
(a) Cardiac mitochondrial density was measured as a ratio of mitochondrial DNA (mtDNA) to nuclear DNA (nDNA) using real time PCR. (b) Representative treansmission electron micrographs from myofibrillar sections of the heart demonstrating normal mitochondria in Wt and Wt+Exe groups, damaged mitochondria from sedentary db/db hearts and damaged mitochondria undergoing fission/fusion (characterized by dual grooves, black arrows) in db/db+Exe mice hearts. Magnification: 16000×. (c) Quantification of total mitochondria undergoing fission expressed per mitochondria from heart sections. (d) mRNA levels of NRF-1, NRF-2 and TFAM in the heart as measured using real time PCR and normalized to 18S RNA. (e) Expression of mitochondrial enzyme transcripts (mt-ND5, COX3, IDH3a) as well as mitochondrial membrane proteins (BCL-2, CPT-1a) was measured using real time PCR and normalized to 18S RNA. Data was analyzed using two-way ANOVA with Bonferroni tests, p<0.05 (n = 6). *P<0.05 versus corresponding Wt group; #P<0.05 versus corresponding sedentary group. Abbreviations: mtDNA, Mitochondrial DNA; nDNA, Nuclear DNA; NRF1, Nuclear respiratory factor 1; NRF2, Nuclear respiratory factor 2; TFAM, Transcription factor A, mitochondrial; mt-ND5, Mitochondrially encoded NADH dehydrogenase 5; COX3, Cyclooxygenase 3; IDH3a, Isocitrate dehydrogenase 3 (NAD+) a; BCL2, B cell leukemia 2; CPT-1a, Carnitine palmitoyltransferase 1a.
Figure 6
Figure 6. Moderate exercise augments mitochondrial membrane proteins but not mitochondrial oxidative phosphorylation complex subunits in db/db hearts.
(a) Quantification of cardiac mitochondrial membrane proteins TOM-70 and (b) VDAC-1 by western blotting. Values are expressed as a ratio to β-actin on the same blot. Inset: representative bands of respective proteins from the same blot. (c) Representative lanes from a single western blot demonstrating relative protein levels of complex-1 to 5 in hearts from each group designated as 1 (sedentary Wt), 2 (Wt+Exe), 3 (sedentary db/db) and 4 (db/db+Exe). Lower band represents β-actin blots from the same gel after stripping and reprobing. (d) Quantification of mitochondrial enzyme complex subunits to β-actin. Relative ratio is expressed in arbitrary units. (e) Heart sections were stained with VDAC-1 and stained with Dylight 594 labeled secondary Ab and co-stained with DAPI to visualize nuclei. Magnification 200×. VDAC-1 staining was attenuated in sedentary db/db mice. However, exercised db/db mice demonstrated sporadic areas of augmented VDAC-1 staining in specific regions of the ventricular tissue (indicated by white boundary line in db/db+Exe. Heart sections were also stained with COX IV, and stained with Dylight 488 labeled secondary Ab. Magnification 600×. COX IV staining was significantly reduced compared to Wt in sedentary db/db mice, which remained unchanged following exercise. (f) Quantification of VDAC-1 immunopositivity in heart sections as a percentage of total cardiac surface area (g) Quantification of COX IV immunopositivity in heart sections as a percentage of total cardiac surface area. Data was analyzed using two-way ANOVA with Bonferroni tests, p<0.05 (n = 6). *P<0.05 versus corresponding Wt group; #P<0.05 versus corresponding sedentary group. Abbreviations: TOM-70, mitochondrial import receptor TOM subunit 70 kDa; VDAC, Voltage-dependent anion channel, CI, Complex I; CII, Complex II; CIII, Complex III; CIV, Complex IV; CV, Complex V; COXIV, Cytochrome c oxidase subunit IV.
Figure 7
Figure 7. Moderate intensity exercise in aged diabetic hearts induces mitochondrial oxidative stress in db/db hearts.
(a) Representative micrographs of SOD2 immunofluorescence from heart sections. Please note the red punctate staining for SOD2 for all groups except db/db+Exe hearts. Magnification: 200×. (b) Quantification of SOD2 immunopositivity in heart sections as a percentage of total cardiac surface area. (c) TBARS levels in the heart as determined by biochemical assays. Data was analyzed using two-way ANOVA with Bonferroni tests, p<0.05 (n = 6). *P<0.05 versus corresponding Wt group; #P<0.05 versus corresponding sedentary group. Abbreviations: SOD2, mitochondrial isoform of superoxide dismutase; TBARS, thiobarbituric acid reactive substances.
Figure 8
Figure 8. Augmented oxidative stress upregulates PGC-1α and inhibits cardiomyocyte inflammatory gene expression in a dose-dependent fashion.
(a) PGC-1α, IL-6 and TNFα gene expressions in H9c2 cardiomyocytes with or without 200 ng/ml LPS. Data was analyzed with two-way Anova with Bonferroni tests, *P<0.05 versus corresponding +LPS (b) PGC-1α, IL-6 and TNFα gene expressions after transfection with either scrambled siRNA or siRNA targeted against PGC-1α. Data was analyzed with two-way ANOVA with Bonferroni tests, *P<0.05 versus scrambled control; #P<0.05 versus scrambled+LPS; $P<0.05 corresponding PGC1α control versus PGC1α+LPS. (c) Effect of increasing doses of H2O2 on PGC1α, IL-6 and TNFα expressions in the presence or absence of PGC1α knockdown. Experiments were done at least twice in triplicates. Data was analyzed using two-way ANOVA with Bonferroni tests, *P<0.05 versus corresponding 0 µM H2O2 with scrambled control; #P<0.05 versus 0 µM H2O2 with PGC1α knockdown. Abbreviations: PGC1α, peroxisome proliferator-activated receptor gamma coactivator 1-alpha; IL-6, interleukin 6; TNFα, tumor necrosis factor alpha; LPS, lipopolysaccharide.
Figure 9
Figure 9. Effect of PGC1α and oxidative stress on downstream transcription factor expression in H9c2 cells.
(a) NRF-1, NRF-2 and TFAM gene expressions after transfection of H9c2 cardiomyocytes with either scrambled siRNA or siRNA targeted against PGC-1α. Data was analyzed with two-way ANOVA with Bonferroni tests, *P<0.05 versus scrambled control; #P<0.05 versus scrambled+LPS; $P<0.05 corresponding PGC1a control versus PGC1a+LPS. (b) Effect of increasing doses of H2O2 on NRF-1, NRF-2 and TFAM gene expressions in H9c2 cardiomyocytes. Experiments were done at least twice in triplicates. Data was analyzed using two-way ANOVA with Bonferroni tests, *P<0.05 versus corresponding 0 µM H2O2; #P<0.05 versus 100 µM H2O2. Abbreviations: PGC1a, peroxisome proliferator-activated receptor gamma coactivator 1-alpha; NRF1, Nuclear respiratory factor 1; NRF2, Nuclear respiratory factor 2; TFAM, Transcription factor A; LPS, lipopolysaccharide.

References

    1. Public Health Agency of Canada (2011) Diabetes in Canada: Facts and figures from a public health perspective.
    1. Joseph AM, Joanisse DR, Baillot RG, Hood DA (2012) Mitochondrial dysregulation in the pathogenesis of diabetes: potential for mitochondrial biogenesis-mediated interventions. Exp Diabetes Res 2012: 642038. - PMC - PubMed
    1. Handschin C, Spiegelman BM (2008) The role of exercise and PGC1alpha in inflammation and chronic disease. Nature 454: 463–469. - PMC - PubMed
    1. Mootha VK, Lindgren CM, Eriksson KF, Subramanian A, Sihag S, et al. (2003) PGC-1alpha-responsive genes involved in oxidative phosphorylation are coordinately downregulated in human diabetes. Nat Genet 34: 267–273. - PubMed
    1. Rowe GC, Jiang A, Arany Z (2010) PGC-1 coactivators in cardiac development and disease. Circ Res 107: 825–838. - PMC - PubMed

Publication types

MeSH terms

Substances