. 2013 Aug 1;8(8):e70266.
doi: 10.1371/journal.pone.0070266. Print 2013.

A handheld point-of-care genomic diagnostic system

Affiliations

A handheld point-of-care genomic diagnostic system

Frank B Myers et al. PLoS One. .

Erratum in

  • PLoS One. 2013;8(9). doi:10.1371/annotation/902dc1bb-9ed7-4e91-a550-0f0a87ce17ba. Bone, Jennifer [corrected to Bone, Jennifer M]

Abstract

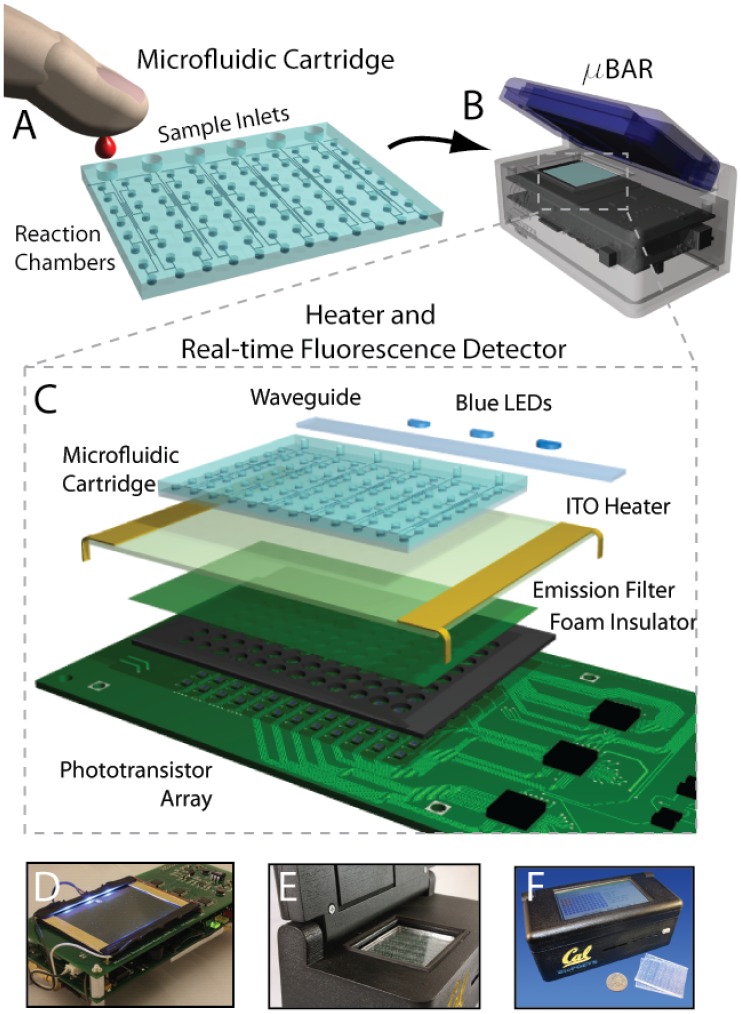
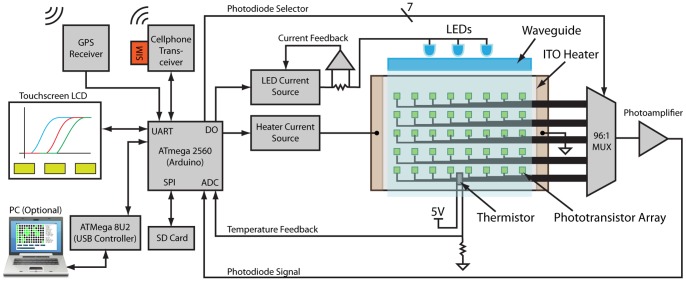
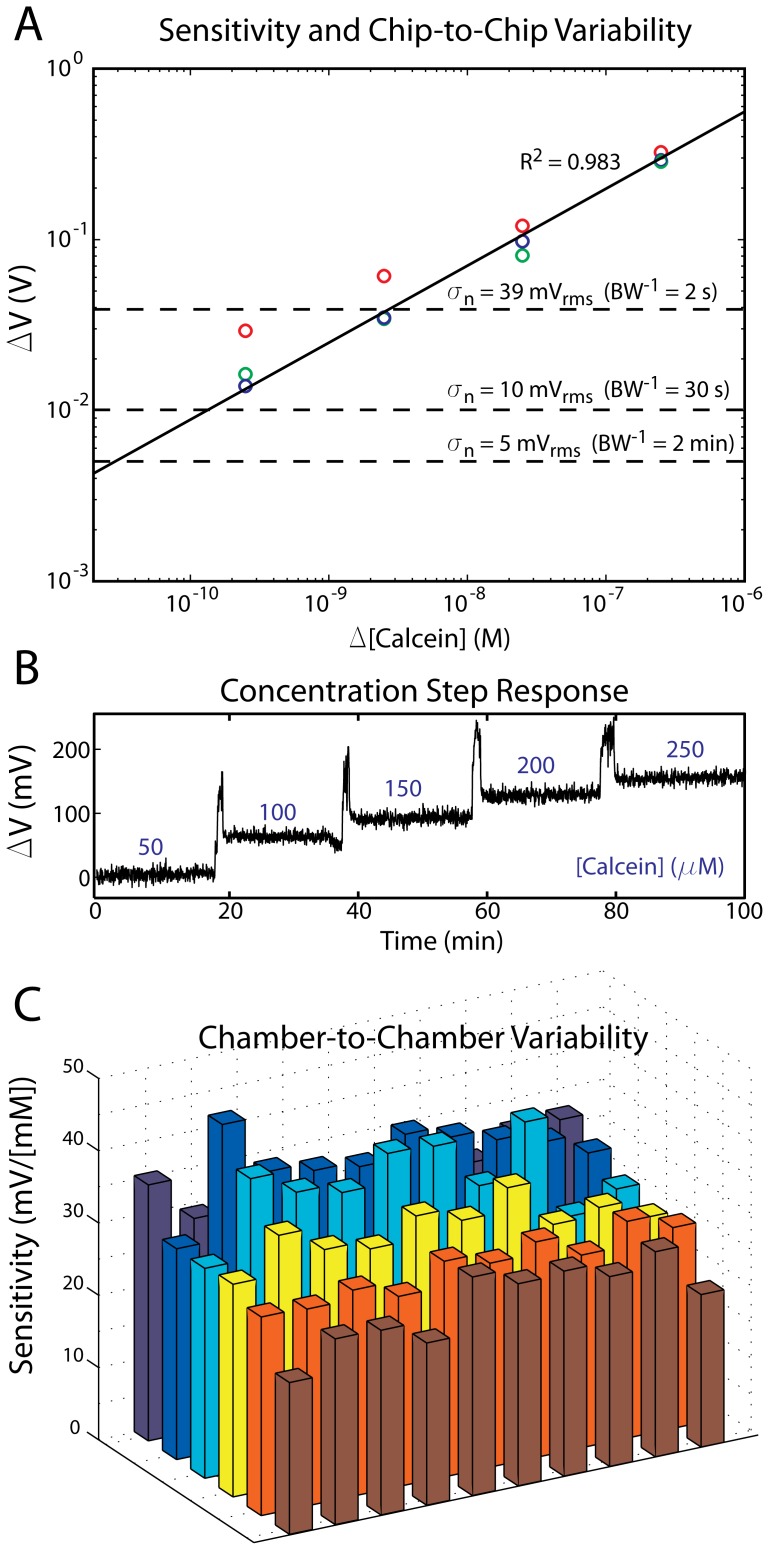
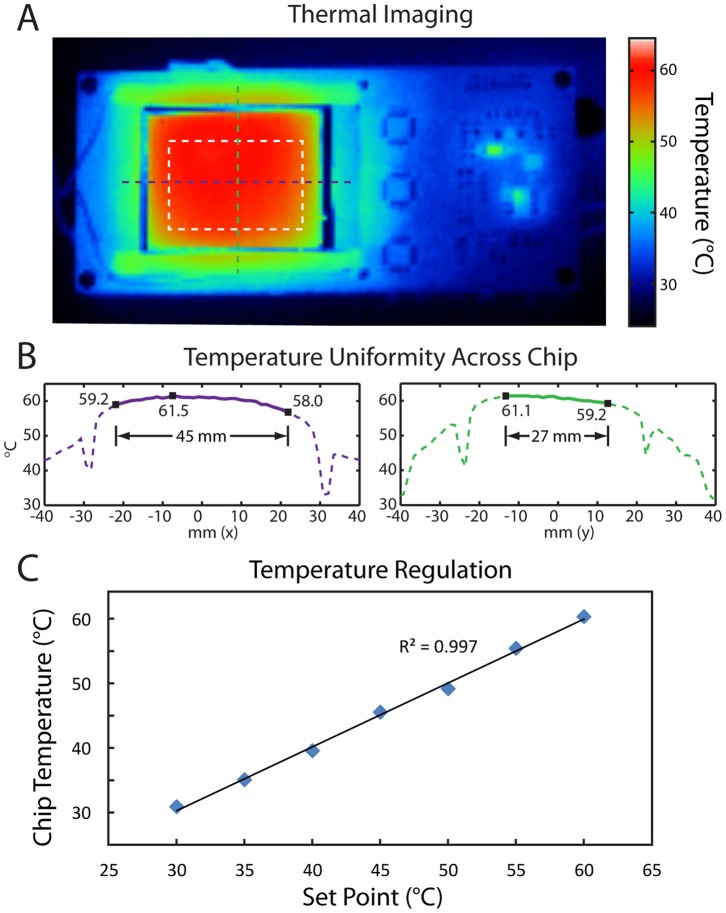
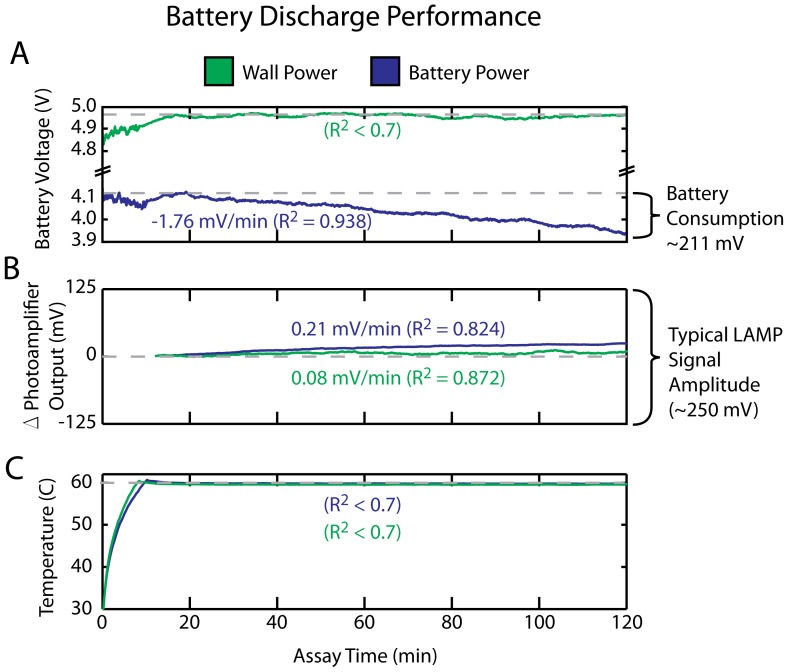
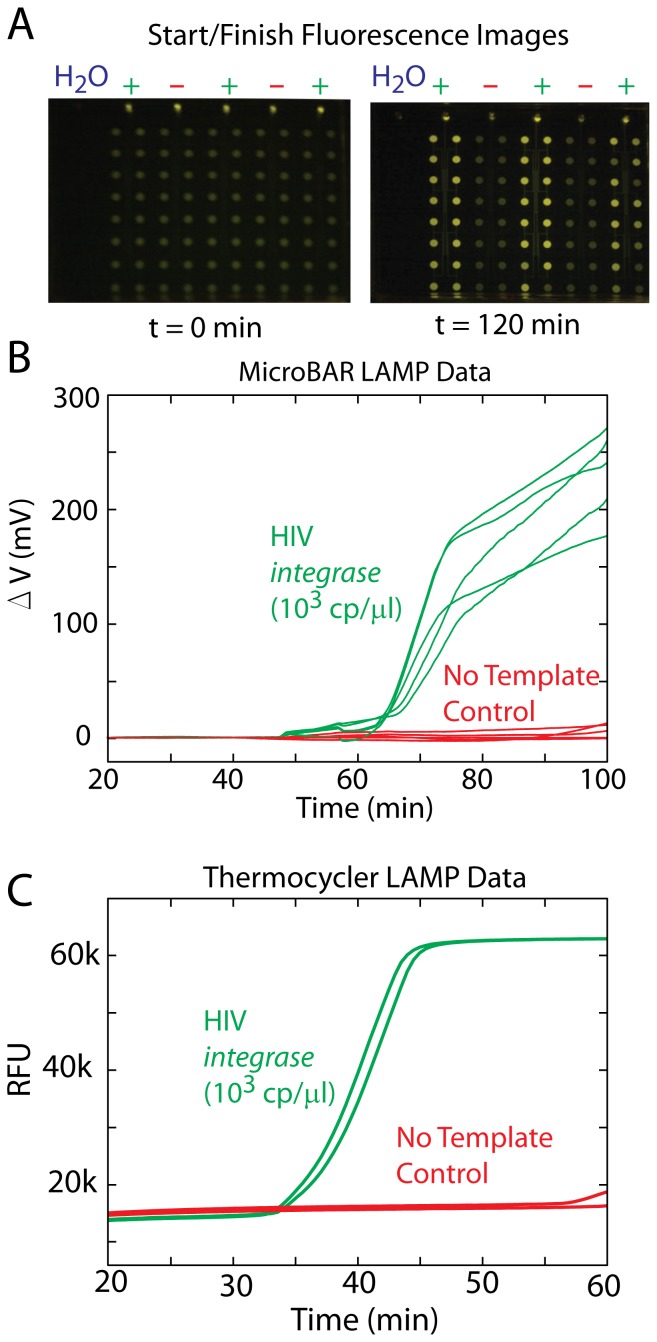
The rapid detection and identification of infectious disease pathogens is a critical need for healthcare in both developed and developing countries. As we gain more insight into the genomic basis of pathogen infectivity and drug resistance, point-of-care nucleic acid testing will likely become an important tool for global health. In this paper, we present an inexpensive, handheld, battery-powered instrument designed to enable pathogen genotyping in the developing world. Our Microfluidic Biomolecular Amplification Reader (µBAR) represents the convergence of molecular biology, microfluidics, optics, and electronics technology. The µBAR is capable of carrying out isothermal nucleic acid amplification assays with real-time fluorescence readout at a fraction of the cost of conventional benchtop thermocyclers. Additionally, the µBAR features cell phone data connectivity and GPS sample geotagging which can enable epidemiological surveying and remote healthcare delivery. The µBAR controls assay temperature through an integrated resistive heater and monitors real-time fluorescence signals from 60 individual reaction chambers using LEDs and phototransistors. Assays are carried out on PDMS disposable microfluidic cartridges which require no external power for sample loading. We characterize the fluorescence detection limits, heater uniformity, and battery life of the instrument. As a proof-of-principle, we demonstrate the detection of the HIV-1 integrase gene with the µBAR using the Loop-Mediated Isothermal Amplification (LAMP) assay. Although we focus on the detection of purified DNA here, LAMP has previously been demonstrated with a range of clinical samples, and our eventual goal is to develop a microfluidic device which includes on-chip sample preparation from raw samples. The µBAR is based entirely around open source hardware and software, and in the accompanying online supplement we present a full set of schematics, bill of materials, PCB layouts, CAD drawings, and source code for the µBAR instrument with the goal of spurring further innovation toward low-cost genetic diagnostics.


Conflict of interest statement

Competing Interests: The authors have declared that no competing interests exist.

Figures

Figure 1
Figure 1. The design of the µBAR system and operation.
(A) A disposable microfluidic cartridge is loaded with sample fluid (e.g. blood) via SIMBAS degas-driven flow. This technique proceeds automatically without any pumping or external power. LAMP reaction mix (primers, enzymes, dNTPs, etc.) may be lyophilized on-chip or mixed with the sample before loading. After 30 min, the chip is fully loaded and is placed in the µBAR instrument. (B–C) The instrument features blue excitation LEDs to the side of the chip. Waveguides help to ensure the light is efficiently coupled to the PDMS chip without stray scattering. An ITO substrate provides uniform heating across the reaction chambers of the chip. Below this substrate is a green plastic emission filter following by a neoprene foam barrier with holes which optically isolate each phototransistor on the PCB underneath. The neoprene provides both thermal and optical insulation to the system. The microfluidic chip sticks to the surface of the ITO via van der Waals forces, maximizing thermal transfer and ensuring that the chip does not move during heating. (D) µBAR with case removed, showing side LED illumination through waveguides. (E) µBAR with chip inserted. (D) Assembled handheld µBAR instrument and microfluidic cartridges with a US quarter for size comparison.
Figure 2
Figure 2. Block diagram of the µBAR system.
The system is controlled by an ATmega 2560 microcontroller which has been loaded with the Arduino bootloader firmware. A GPS receiver and cell phone transceiver facilitate remote field diagnostics and epidemiological studies. The system can receive user input via either an LCD touchscreen or PC via USB. Data is stored to an SD card and also broadcast to the PC, if connected. A monolithic LED driver supplies a constant current to 3 blue InGaAs LEDs (even as battery voltage decreases), and a booster circuit delivers a constant current to the ITO heater. The microcontroller receives temperature feedback from a thermistor and turns the heater on and off accordingly. An array of 96 phototransistors are positioned underneath the heater and an analog multiplexer is used to raster across the array and read photocurrents from each location using a single photoamplifier.
Figure 3
Figure 3. Fluorescence sensitivity and linearity.
(A) Different concentrations of calcein were introduced into a microfluidic cartridge and the corresponding change in photoamplifier voltage was recorded. The circles indicate the mean signal amplitude across all reaction wells for three different chips (red, green, and blue). As expected, the relationship between calcein concentration and photoamplifier output is linear (R2 = 0.983). Limit of detection can be evaluated by determining when this trend line crosses the noise floor of the instrument at a given bandwidth. At a time resolution (BW−1) of 2 min, the µBAR can distinguish changes in calcein concentration of 30 pM, which is orders of magnitude below the fluorophore concentrations typically used in nucleic acid amplification reactions. (B) 50 µM steps of calcein are clearly visible in the photoamplifier output and this output remains stable for a constant concentration. (C) Due to the nature of the illumination scheme and the lack of optics, there is some nonuniformity of sensitivity across the 6×10 reaction chamber array. However, we take this into account and normalize each well by its mean sensitivity, shown here. In this graphic, the illumination LEDs and sample inlets are located above the topmost row.
Figure 4
Figure 4. Heater uniformity and stability.
(A) Infrared thermal image of the µBAR (case removed) at 60°C. The white box indicates the extent of the 6×10 reaction chamber array. (B) Linescans through this region indicate a temperature uniformity of ±1.25°C. (C) Chip temperature, as measured with a thermocouple directly embedded in the PDMS, versus µBAR temperature set point.
Figure 5
Figure 5. Battery discharge performance of the µBAR.
The µBAR maintains constant LED intensity and chip temperature over a 2 hr period when operated from a battery. Since a battery’s voltage decreases as it is discharged, we wanted to ensure that this would not obscure results of the assay by either causing drift in the photoamplifier output or chip temperature. In this experiment, the battery voltage decreases linearly by 211 mV over the course of the assay run (A). This, however, does not significantly impact the intensity of the LEDs/photoamplifier sensitivity (B), or temperature stability (C), as compared with a constant (wall) power source. Dashed lines show the values of battery voltage, photoamplifier output, and temperature at t = 20 min, linear regressions are calculated and slopes are reported for R2 values >0.7. There is no significant change in temperature for either wall or battery power. Photoamplifier output shows a slight time dependant drift in both cases (7.5 mV/min for wall power and 2.5 mV/min for battery power), but this drift is significantly lower than the signal amplitudes which we see in a typical LAMP assay (∼250 mV, see fig. 6), so we consider it acceptable.
Figure 6
Figure 6. µBAR LAMP vs.
Thermocycler LAMP. Results of the LAMP reaction for detection of the HIV integrase gene using both the µBAR and a conventional thermocycler. (A) Presence of the HIV integrase gene target results in an increase in fluorescence from the reaction wells, as seen in these before and after chip photos. (B) Photoamplifier voltages from 5 independent reaction wells are displayed here, all showing a positive result after about 70 minutes. (C) The same assay run on a conventional thermocycler shows positive results slightly faster (40 minutes), possibly due to the differences in assay volumes and thermal transfer characteristics.

References

    1. Chin CD, Linder V, Sia SK (2007) Lab-on-a-chip devices for global health: Past studies and future opportunities. Lab Chip 7: 41–57 doi:10.1039/b611455e. - DOI - PubMed
    1. Robertson BH, Nicholson JKA (2005) New microbiology tools for public health and their implications. Annu Rev Public Health 26: 281–302 doi:10.1146/annurev.publhealth.26.021304.144522. - DOI - PubMed
    1. Wilson PE, Alker AP, Meshnick SR (2005) Real-time PCR methods for monitoring antimalarial drug resistance. Trends Parasitol 21: 278–283 doi:10.1016/j.pt.2005.04.007. - DOI - PubMed
    1. Arnold C, Westland L, Mowat G, Underwood A, Magee J, et al. (2005) Single-nucleotide polymorphism-based differentiation and drug resistance detection in Mycobacterium tuberculosis from isolates or directly from sputum. Clin Microbiol Infect 11: 122–130 doi:10.1111/j.1469-0691.2004.01034.x. - DOI - PubMed
    1. Perkins M, Cunningham J (2006) Diagnostics for Tuberculosis: Global Demand and Market Potential. Word Health Organization. Available: http://www.finddiagnostics.org/export/sites/default/resource-centre/find....

Publication types

MeSH terms