

Role of CTLA4 in the proliferation and survival of chronic lymphocytic leukemia
- PMID: 23936412
- PMCID: PMC3731360
- DOI: 10.1371/journal.pone.0070352
Role of CTLA4 in the proliferation and survival of chronic lymphocytic leukemia
Abstract
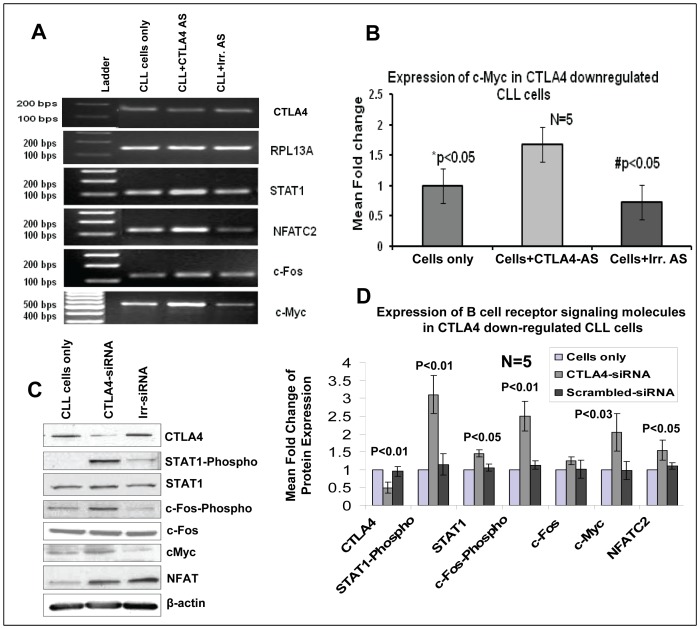
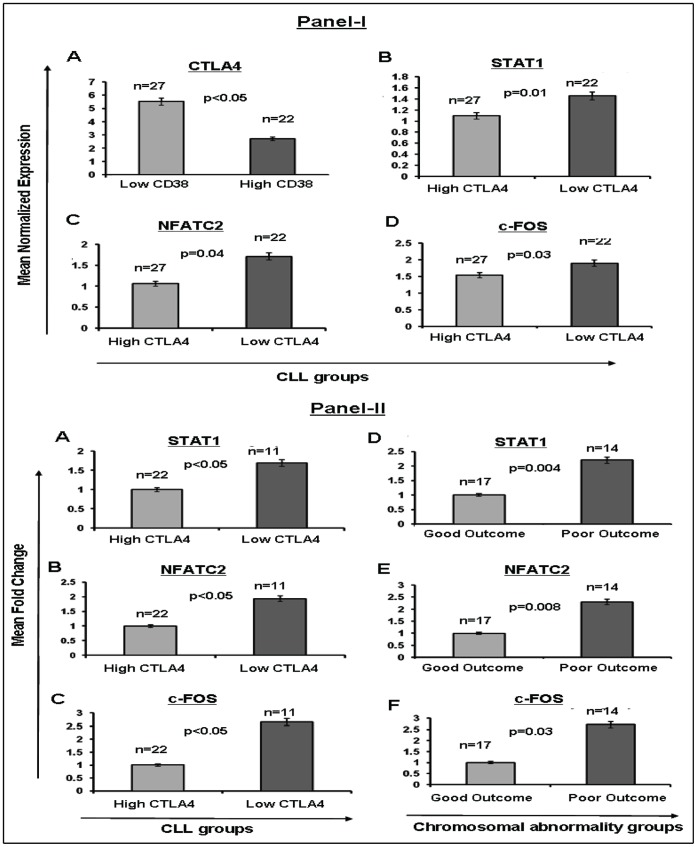
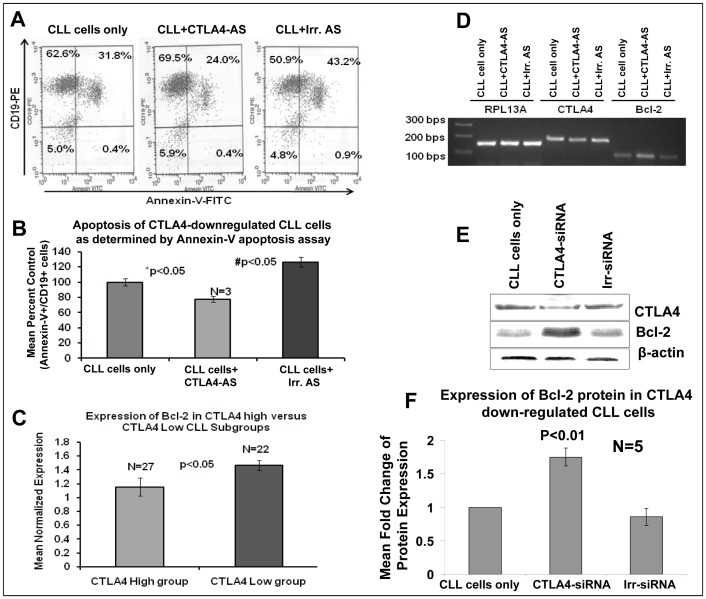
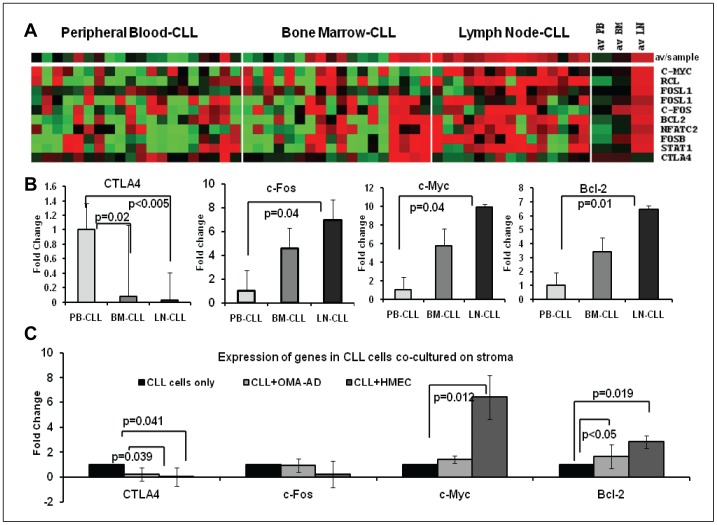
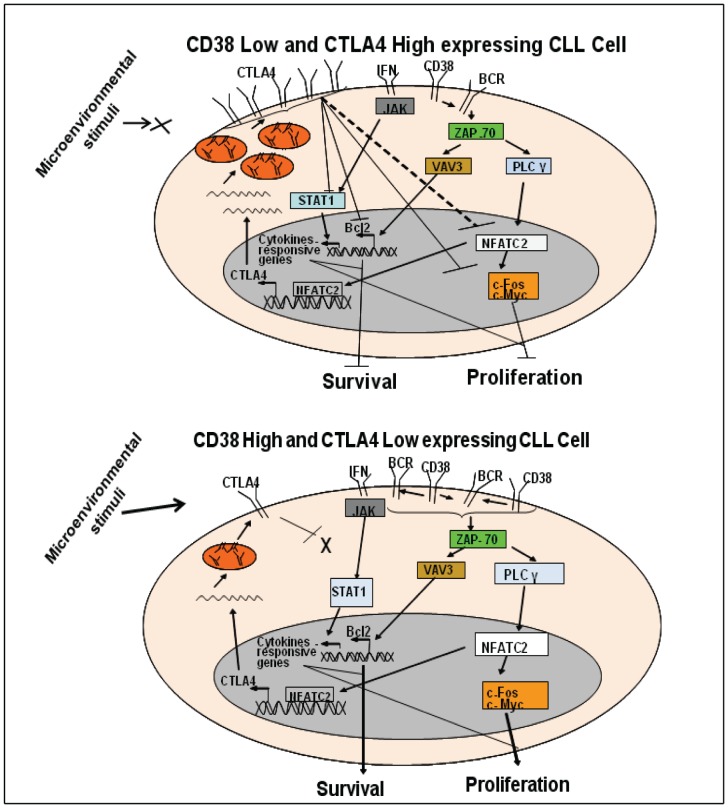
Earlier, we reported that CTLA4 expression is inversely correlated with CD38 expression in chronic lymphocytic leukemia (CLL) cells. However, the specific role of CTLA4 in CLL pathogenesis remains unknown. Therefore, to elucidate the possible role of CTLA4 in CLL pathogenesis, CTLA4 was down-regulated in primary CLL cells. We then evaluated proliferation/survival in these cells using MTT, (3)H-thymidine uptake and Annexin-V apoptosis assays. We also measured expression levels of downstream molecules involved in B-cell proliferation/survival signaling including STAT1, NFATC2, c-Fos, c-Myc, and Bcl-2 using microarray, PCR, western blotting analyses, and a stromal cell culture system. CLL cells with CTLA4 down-regulation demonstrated a significant increase in proliferation and survival along with an increased expression of STAT1, STAT1 phosphorylation, NFATC2, c-Fos phosphorylation, c-Myc, Ki-67 and Bcl-2 molecules. In addition, compared to controls, the CTLA4-downregulated CLL cells showed a decreased frequency of apoptosis, which also correlated with increased expression of Bcl-2. Interestingly, CLL cells from lymph node and CLL cells co-cultured on stroma expressed lower levels of CTLA4 and higher levels of c-Fos, c-Myc, and Bcl-2 compared to CLL control cells. These results indicate that microenvironment-controlled-CTLA4 expression mediates proliferation/survival of CLL cells by regulating the expression/activation of STAT1, NFATC2, c-Fos, c-Myc, and/or Bcl-2.
Conflict of interest statement
Figures

Similar articles
-
The Akt/Mcl-1 pathway plays a prominent role in mediating antiapoptotic signals downstream of the B-cell receptor in chronic lymphocytic leukemia B cells.Blood. 2008 Jan 15;111(2):846-55. doi: 10.1182/blood-2007-05-089037. Epub 2007 Oct 10. Blood. 2008. PMID: 17928528
-
Differential bone marrow homing capacity of VLA-4 and CD38 high expressing chronic lymphocytic leukemia cells.PLoS One. 2011;6(8):e23758. doi: 10.1371/journal.pone.0023758. Epub 2011 Aug 18. PLoS One. 2011. PMID: 21876768 Free PMC article.
-
Long intergenic non-coding RNA-p21 is associated with poor prognosis in chronic lymphocytic leukemia.Clin Transl Oncol. 2021 Jan;23(1):92-99. doi: 10.1007/s12094-020-02398-4. Epub 2020 May 28. Clin Transl Oncol. 2021. PMID: 32468342
-
In-tandem insight from basic science combined with clinical research: CD38 as both marker and key component of the pathogenetic network underlying chronic lymphocytic leukemia.Blood. 2006 Aug 15;108(4):1135-44. doi: 10.1182/blood-2006-01-013003. Epub 2006 Apr 18. Blood. 2006. PMID: 16621959 Review.
-
The pathogenic relevance of the prognostic markers CD38 and CD49d in chronic lymphocytic leukemia.Ann Hematol. 2014 Mar;93(3):361-74. doi: 10.1007/s00277-013-1967-y. Epub 2013 Nov 28. Ann Hematol. 2014. PMID: 24288111 Free PMC article. Review.
Cited by
-
Immune Checkpoint Pathway Expression in Lymphocyte Subpopulations in Patients with Common Variable Immunodeficiency and Chronic Lymphocytic Leukemia.Cancers (Basel). 2023 Oct 28;15(21):5184. doi: 10.3390/cancers15215184. Cancers (Basel). 2023. PMID: 37958359 Free PMC article.
-
Role of Non-Coding RNAs in the Development of Targeted Therapy and Immunotherapy Approaches for Chronic Lymphocytic Leukemia.J Clin Med. 2020 Feb 21;9(2):593. doi: 10.3390/jcm9020593. J Clin Med. 2020. PMID: 32098192 Free PMC article. Review.
-
Current Approaches of Immune Checkpoint Therapy in Chronic Lymphocytic Leukemia.Curr Treat Options Oncol. 2023 Oct;24(10):1408-1438. doi: 10.1007/s11864-023-01129-5. Epub 2023 Aug 10. Curr Treat Options Oncol. 2023. PMID: 37561383 Review.
-
Beyond T-Cells: Functional Characterization of CTLA-4 Expression in Immune and Non-Immune Cell Types.Front Immunol. 2020 Dec 15;11:608024. doi: 10.3389/fimmu.2020.608024. eCollection 2020. Front Immunol. 2020. PMID: 33384695 Free PMC article. Review.
-
Immune checkpoint inhibition therapy for advanced skin cancer in patients with concomitant hematological malignancy: a retrospective multicenter DeCOG study of 84 patients.J Immunother Cancer. 2020 Oct;8(2):e000897. doi: 10.1136/jitc-2020-000897. J Immunother Cancer. 2020. PMID: 33093156 Free PMC article.
References
-
- Dighiero G, Hamblin TJ (2008) Chronic lymphocytic leukaemia. Lancet 371: 1017–29. - PubMed
-
- Chiorazzi N, Rai KR, Ferrarini M (2005) Chronic lymphocytic leukemia. N Engl J Med 352: 804–15. - PubMed
-
- Dickinson JD, Joshi A, Iqbal J, Sanger W, Bierman PJ, et al. (2006) Genomic abnormalities in chronic lymphocytic leukemia influence gene expression by a gene dosage effect. Int J Mol Med 17: 769–78. - PubMed
-
- Joshi AD, Hegde GV, Dickinson JD, Mittal AK, Lynch JC, et al. (2007) ATM, CTLA4, MNDA, and HEM1 in high versus low CD38 expressing B-cell chronic lymphocytic leukemia. Clin Cancer Res 13: 5295–304. - PubMed
Publication types
MeSH terms
Substances
LinkOut - more resources
Full Text Sources
Other Literature Sources
Research Materials
Miscellaneous
