. 2013 Aug 1;8(8):e70622.
doi: 10.1371/journal.pone.0070622. Print 2013.

Distinct mechanisms for induction and tolerance regulate the immediate early genes encoding interleukin 1β and tumor necrosis factor α

Affiliations

Distinct mechanisms for induction and tolerance regulate the immediate early genes encoding interleukin 1β and tumor necrosis factor α

Juraj Adamik et al. PLoS One. .

Abstract

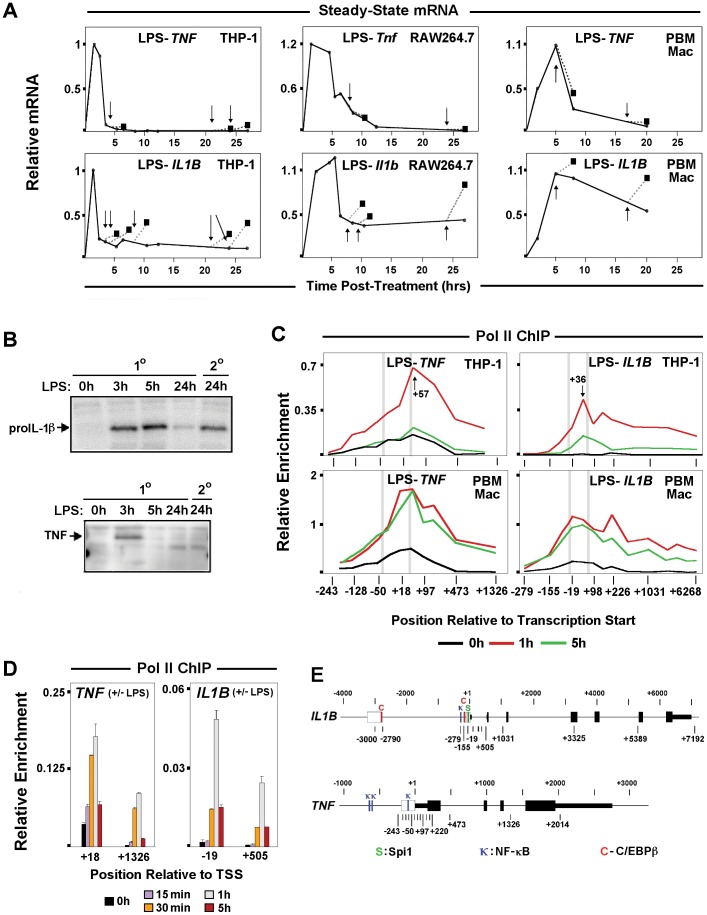
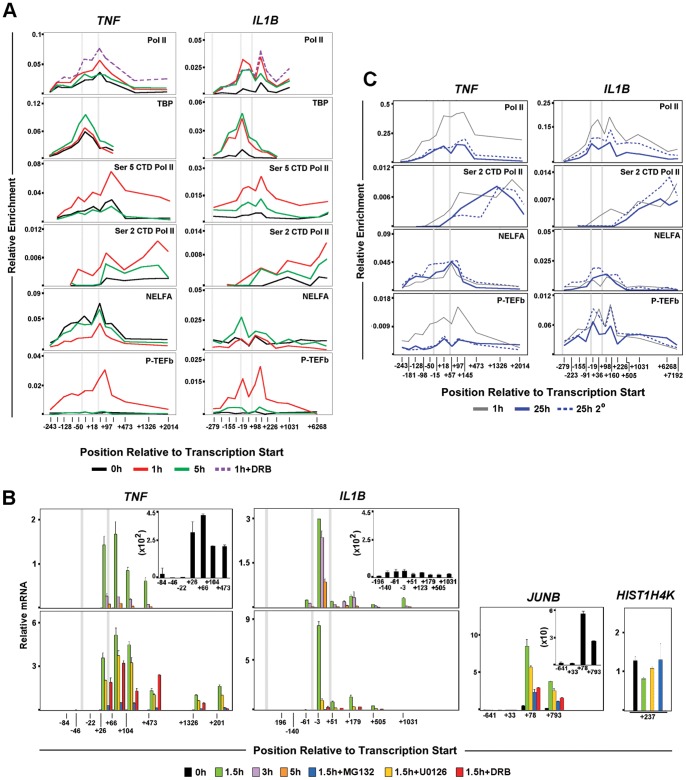
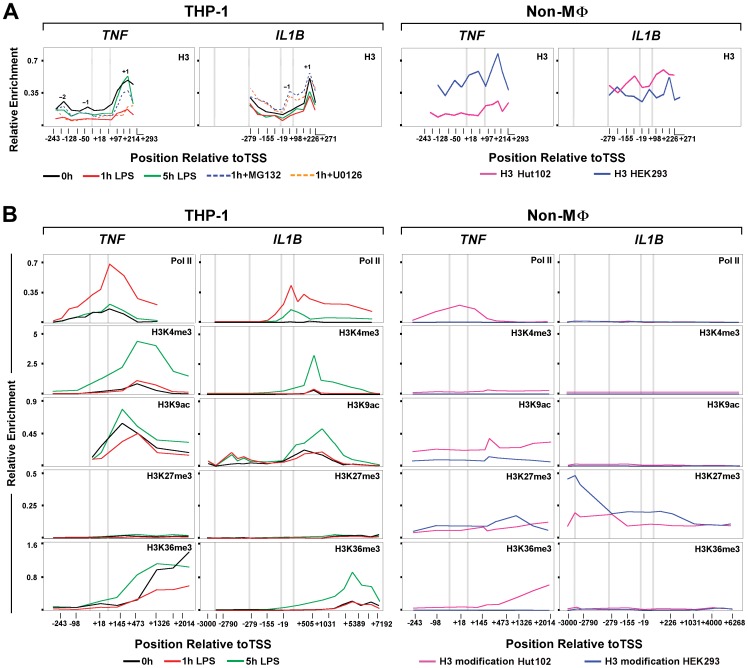
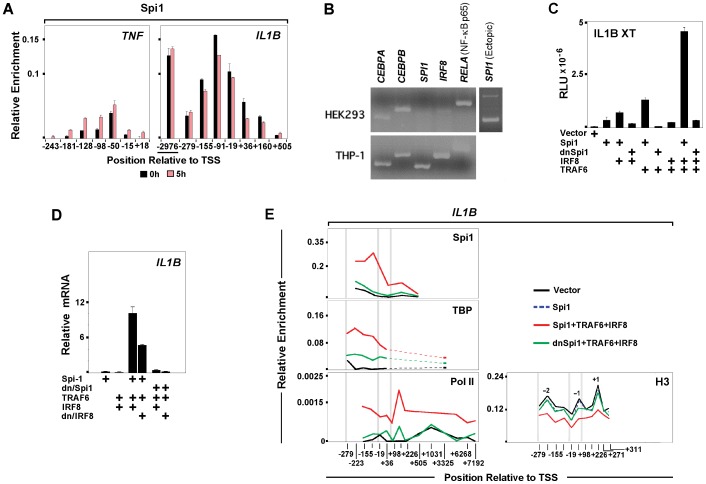
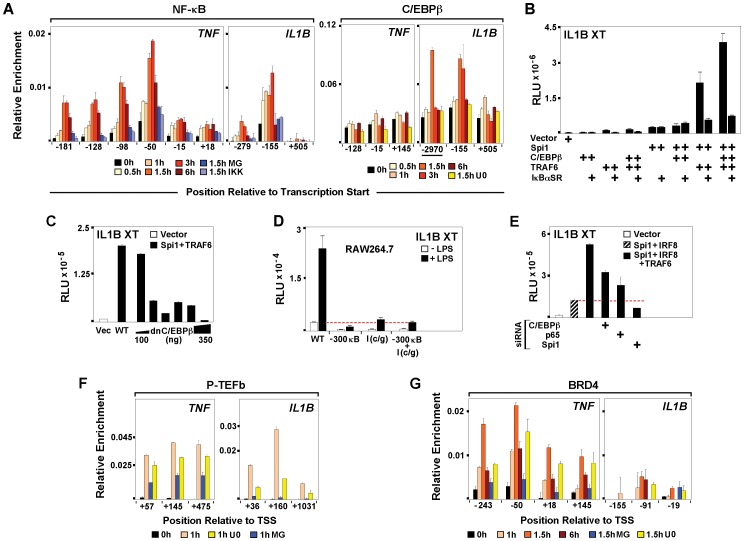
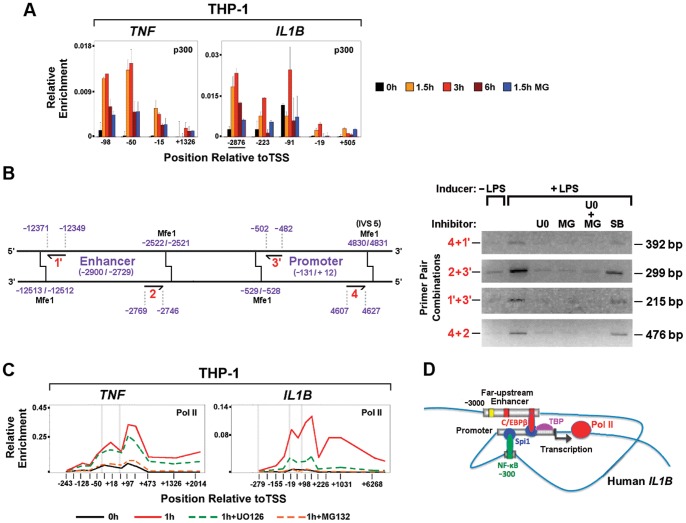
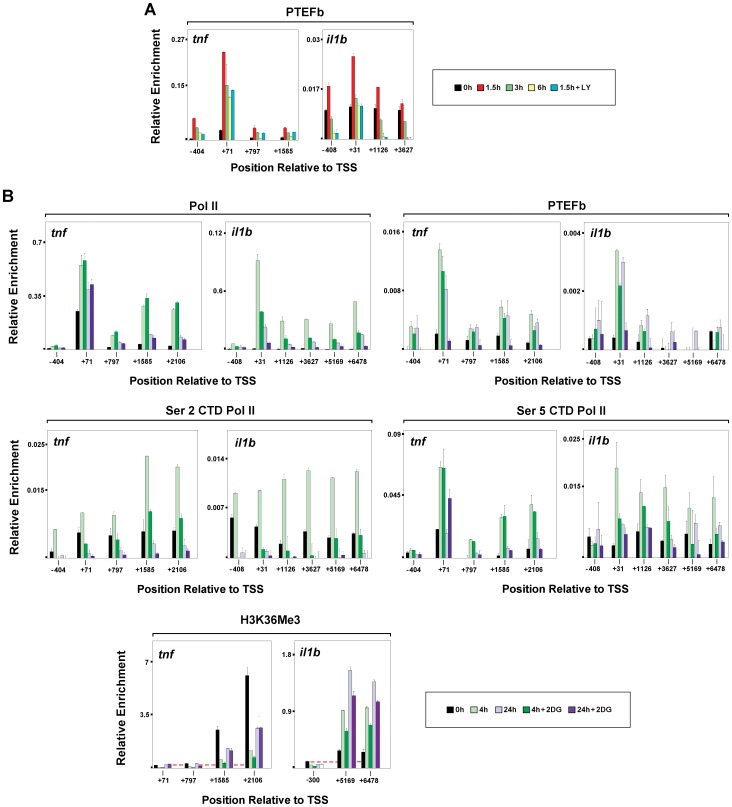
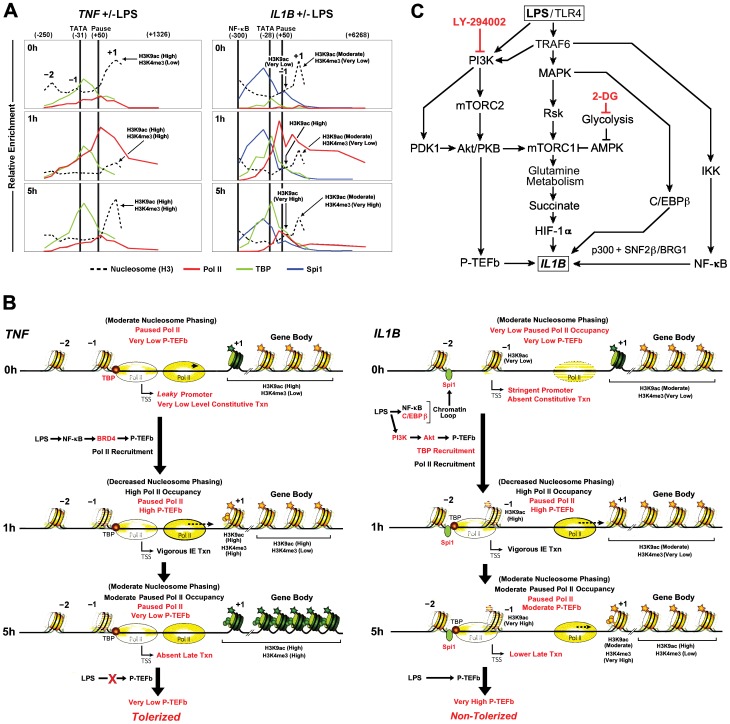
Interleukin-1β and Tumor Necrosis Factor α play related, but distinct, roles in immunity and disease. Our study revealed major mechanistic distinctions in the Toll-like receptor (TLR) signaling-dependent induction for the rapidly expressed genes (IL1B and TNF) coding for these two cytokines. Prior to induction, TNF exhibited pre-bound TATA Binding Protein (TBP) and paused RNA Polymerase II (Pol II), hallmarks of poised immediate-early (IE) genes. In contrast, unstimulated IL1B displayed very low levels of both TBP and paused Pol II, requiring the lineage-specific Spi-1/PU.1 (Spi1) transcription factor as an anchor for induction-dependent interaction with two TLR-activated transcription factors, C/EBPβ and NF-κB. Activation and DNA binding of these two pre-expressed factors resulted in de novo recruitment of TBP and Pol II to IL1B in concert with a permissive state for elongation mediated by the recruitment of elongation factor P-TEFb. This Spi1-dependent mechanism for IL1B transcription, which is unique for a rapidly-induced/poised IE gene, was more dependent upon P-TEFb than was the case for the TNF gene. Furthermore, the dependence on phosphoinositide 3-kinase for P-TEFb recruitment to IL1B paralleled a greater sensitivity to the metabolic state of the cell and a lower sensitivity to the phenomenon of endotoxin tolerance than was evident for TNF. Such differences in induction mechanisms argue against the prevailing paradigm that all IE genes possess paused Pol II and may further delineate the specific roles played by each of these rapidly expressed immune modulators.


Conflict of interest statement

Competing Interests: The authors have declared that no competing interests exist.

Figures

Figure 1
Figure 1. Comparison of IL1B and TNF expression in monocytes.
(A) Steady-state mRNA kinetics for IL1B and TNF transcripts in LPS stimulated THP-1, RAW264.7 and human peripheral blood mononuclear cells (hPBMC). Solid lines denote mRNA levels for primary LPS challenge. Squares show transcript levels following re-stimulation, as indicated by arrows. (B) Western blot for 30 KDa proIL-1β precursor protein. (C) Pol II ChIP throughout the IL1B and TNF loci in resting (black), 1 h (red) and 5 h (green) LPS stimulated THP-1, RAW264.7 and hPBMC cells. Vertical gray bars locate the positions of important gene landmarks. These include TATA box and the canonical Pol II pause position (approximately 30 bp upstream and 50 bp downsteam of TSS, respectively). (D) Pol II ChIP at promoter and downstream sites for IL1B and TNF. E. Schematic of IL1B and TNF gene structures showing exons (solid boxes), positions of ChIP amplicons (midpoint relative to TSS), and important transcription factor binding sites (C: C/EBPβ, κ: NF-κB and S: Spi1) within regulatory regions (open boxes).
Figure 2
Figure 2. Distribution of factors relevant to differential transcription regulation and endotoxin tolerance for IL1B.
(A) ChIP for factors related to Pol II elongation at IL1B and TNF loci in THP-1 cells. (B) Steady-state mRNA kinetic positional profiles for IL1B, TNF and control gene transcripts, as indicated, in LPS stimulated THP-1. (C) ChIP for IL1B and TNF during secondary LPS stimulation of THP-1 cells. The solid and dotted plots represent primary and secondary LPS treatment, respectively, of THP-1 cells at indicated times. Thin gray plot denotes 1 h LPS reference curve. For all panels, along with the two gene landmarks in Figure 1C, an additional vertical gray bar designates the location of an important NF-κB binding site (near −300 bp) for IL1B.
Figure 3
Figure 3. Nucleosome positioning dynamics and modifications during IL1B and TNF induction.
(A) Kinetic ChIP of histone 3 (H3) for IL1B and TNF in THP-1 and control Hut102 and HEK293 cells, as indicated. Key nucleosomes are designated by position relative to the TSS (−2, −1, +1). (B) ChIP for histone modifications at IL1B and TNF, as indicated for each cell line. All panels are similarly scaled with respect to spatial distribution along each gene, permitting comparative localization. For all panels, along with the three gene landmarks in Figure 2, an additional vertical gray bar designates the approximate location of the far-upstream enhancer (−3000 bp) for IL1B.
Figure 4
Figure 4. Spi1 mediates monocyte-specific IL1B expression.
(A) Spi1 ChIP for IL1B and TNF in control and LPS-treated THP-1 cells. (B) Transcription factor mRNA expression profiles in HEK293 and THP-1 cells. A third panel (and data in Figure S5H) displays ectopic mRNA expression of Spi1 in transfected HEK293. (C) IL1BXT-Luc reporter activity for ectopic expression of indicated factors in HEK293. (D) Endogenous IL1B mRNA expression in transfected HEK293. (E) ChIP for endogenous TBP, Pol II and H3 with ectopic Spi1 in HEK293. Vertical gray bars designating important gene landmarks are as described in Figure 3.
Figure 5
Figure 5. LPS-activated C/EBPβ interaction with Spi1 differentiates induction of IL1B and TNF.
(A) NF-κB and C/EBPβ ChIP for THP-1 cells, as indicated. (B) Effect of ectopic expression of IκBα super repressor (IκBαSR) on IL1B XT-Luc reporter activity in HEK293 cotransfected with indicated factors. (C) Effect of dnC/EBPβ titration on IL1B XT-Luc reporter activity in HEK293. (D) Effect of C/EBPβ and NF-κB binding site mutations on IL1BXT-Luc reporter activity in RAW264.7. (E) XT-Luc reporter activity, as indicated in HEK293 cotransfected with C/EBPβ, NF-κB and Spi1 siRNA. (F) P-TEFb and (G) BRD4 ChIP in THP treated, as indicated.
Figure 6
Figure 6. LPS-dependent p300 binding and transcription factor-mediated promoter-enhancer looping at IL1B.
(A) Inducible p300 binding at IL1B and TNF. (B) Schematic representation of PCR primer pairs used for evaluating 3C ligation products (Left) and PCR assessment of 3C ligation restriction fragment products in the absence and presence of U0126 and MG132 inhibitors. (C) Effects of U0126 and MG132 inhibitors on Pol II ChIP for IL1B and TNF, as indicated. (D) Model for chromatin looping during activation of IL1B.
Figure 7
Figure 7. Distinct metabolic sensitivity for transcription elongation on Il1b and Tnf in murine bone marrow-derived monocytes.
(A) P-TEFb ChIP for mouse RAW264.7 Il1b and Tnf genes in the presence of LY-294002 inhibition. (B) Pol II, PTEFb, S2P CTD Pol II, S2P CTD Pol II and H3K36me3 ChIP, as indicated, for 2DG-treated mouse BMDM. The BMDM were stimulated for indicated times with LPS plus or minus 3 h pretreatment with 2–DG.
Figure 8
Figure 8. Proposed mechanism for LPS mediates induction of IL1B and TNF in monocytes.
(A) Summary of ChIP kinetics for some key features of IL1B and TNF in THP-1 monocytes. Pol II, TBP and Spi1 are as indicated. Histone modifications at specific locations detailed in the text are labeled. Key nucleosomes are designated by position relative to the TSS (−2, −1, +1). (B) Models for IL1B and TNF gene regulation. Red text highlights important distinctions between the two genes along the induction kinetic. Nucleosomes are marked with stars (acetylation) and spheres (trimethylation) representative of significant increases in modification. Darkly colored nucleosomes are likely to be less dynamic and suggestive of impediments to gene expression. The indicated locations of Pol II are represented by various levels of intensity, reflecting the relative degree of proposed dwelling on DNA. Arrowheads on Pol II represent the relative efficiency of elongation, as indicated by the length of the associated dotted line. (C) Schematic representation of the relationships between metabolic pathways involved in IL1B gene activation, summarizing key elements from this study and that recently reported elsewhere .

References

    1. Zhou Q, Li T, Price DH (2012) RNA polymerase II elongation control. Annu Rev Biochem 81: 119–143. - PMC - PubMed
    1. Foster SL, Hargreaves DC, Medzhitov R (2007) Gene-specific control of inflammation by TLR-induced chromatin modifications. Nature 447: 972–978. - PubMed
    1. Fenton MJ, Vermeulen MW, Clark BD, Webb AC, Auron PE (1988) Human pro-IL-1b gene expression in monocytic cells is regulated by two distinct pathways. J Immunol 140: 2267–2273. - PubMed
    1. Zuckerman SH, Evans GF, Butler LD (1991) Endotoxin tolerance: independent regulation of interleukin-1 and tumor necrosis factor expression. Infect Immun 59: 2774–2780. - PMC - PubMed
    1. Hagemeier C, Bannister AJ, Cook A, Kouzarides T (1993) The activation domain of transcription factor PU.1 binds the retinoblastoma (RB) protein and the transcription factor TFIID in vitro: RB shows sequence similarity to TFIID and TFII. Proc Natl Acad Sci USA 90: 1580–1584. - PMC - PubMed

Publication types

MeSH terms

LinkOut - more resources