

Decreased interhemispheric coordination in treatment-resistant depression: a resting-state fMRI study
- PMID: 23936504
- PMCID: PMC3732240
- DOI: 10.1371/journal.pone.0071368
Decreased interhemispheric coordination in treatment-resistant depression: a resting-state fMRI study
Abstract
Background: Previous studies have demonstrated that patients with treatment-resistant depression (TRD) and treatment-sensitive depression (TSD) differed at neural level. However, it remains unclear if these two subtypes of depression differ in the interhemispheric coordination. This study was undertaken for two purposes: (1) to explore the differences in interhemispheric coordination between these two subtypes by using the voxel-mirrored homotopic connectivity (VMHC) method; and (2) to determine if the difference of interhemispheric coordination can be used as a biomarker(s) to differentiate TRD from both TSD and healthy subjects (HS).
Methods: Twenty-three patients with TRD, 22 with TSD, and 19 HS participated in the study. Data of these participants were analyzed with the VMHC and seed-based functional connectivity (FC) approaches.
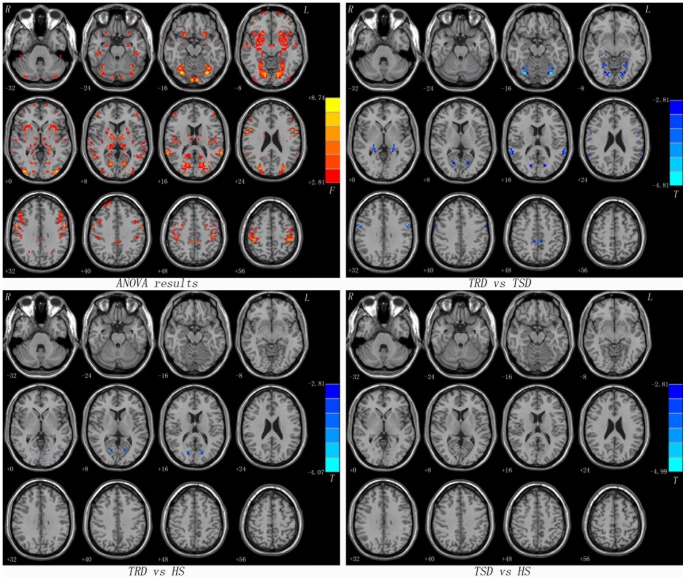
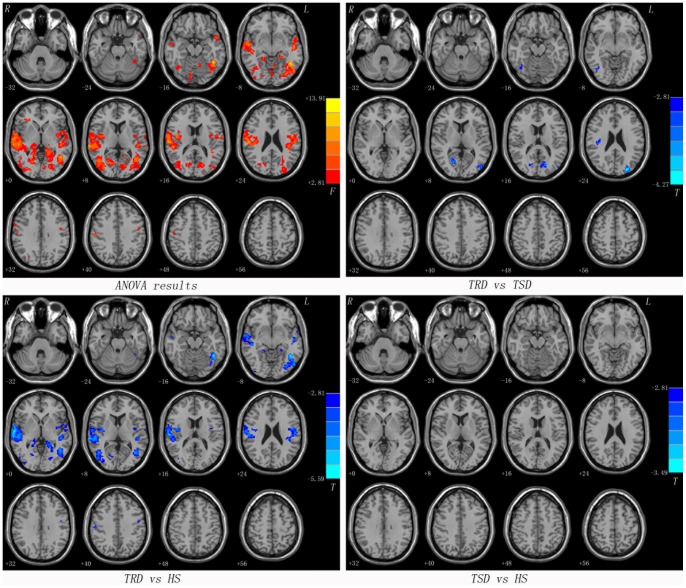
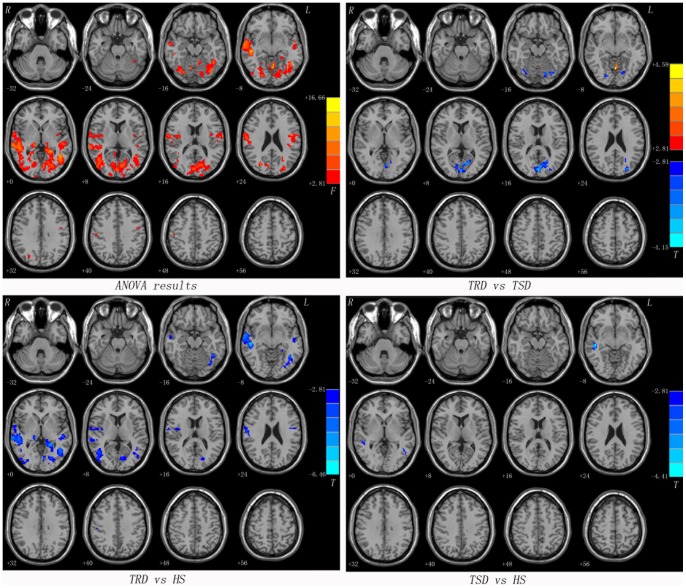
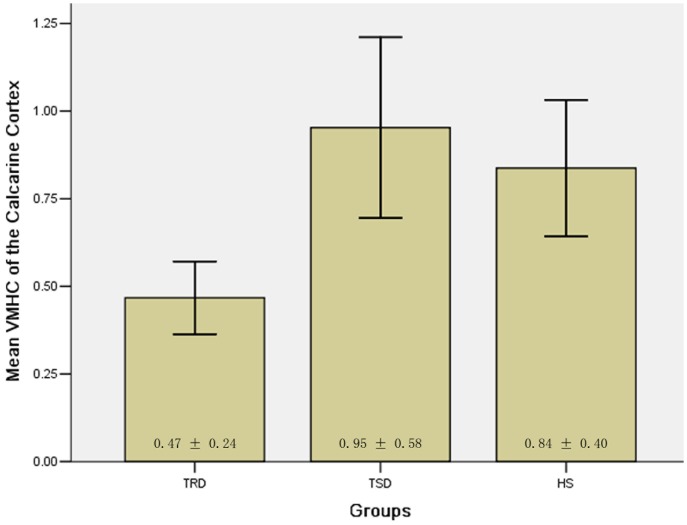
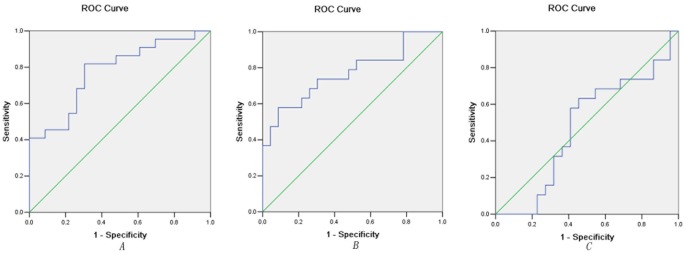
Results: Compared to the TSD group, the TRD group showed significantly lower VMHC values in the calcarine cortex, fusiform gyrus, hippocampus, superior temporal gyrus, middle cingulum, and precentral gyrus. Lower VMHC values were also observed in the TRD group in the calcarine cortex relative to the HS group. However, the TSD group had no significant change in VMHC value in any brain region compared to the HS group. Receiver operating characteristic curves (ROC) analysis revealed that the VMHC values in the calcarine cortex had discriminatory function distinguishing patients with TRD from patients with TSD as well as those participants in the HS group.
Conclusions: Lower VMHC values of patients with TRD relative to those with TSD and those in the HS group in the calcarine cortex appeared to be a unique feature for patients with TRD and it may be used as an imaging biomarker to separate patients with TRD from those with TSD or HS.
Conflict of interest statement
Figures
References
-
- Petersen T, Gordon JA, Kant A, Fava M, Rosenbaum JF, et al. (2001) Treatment resistant depression and axis I co-morbidity. Psychol Med 31: 1223–1229. - PubMed
-
- Stimpson N, Agrawal N, Lewis G (2002) Randomised controlled trials investigating pharmacological and psychological interventions for treatment-refractory depression. Systematic review. Br J Psychiatry 181: 284–294. - PubMed
-
- Little A (2009) Treatment-resistant depression. Am Fam Physician 80: 167–172. - PubMed
-
- Bschor T (2010) Therapy-resistant depression. Expert Rev Neurother 10: 77–86. - PubMed
-
- Fagiolini A, Kupfer DJ (2003) Is treatment-resistant depression a unique subtype of depression? Biol Psychiatry 53: 640–648. - PubMed
Publication types
MeSH terms
LinkOut - more resources
Full Text Sources
Other Literature Sources
Medical
