Review
. 2012 Nov;1(2):169-80.
doi: 10.2217/cns.12.25.

Diffusion-weighted MRI as a biomarker for treatment response in glioma

Review

Diffusion-weighted MRI as a biomarker for treatment response in glioma

Kathleen M Schmainda. CNS Oncol. 2012 Nov.

Abstract

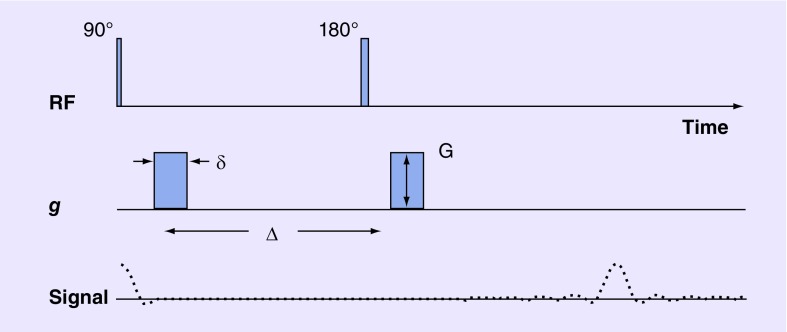
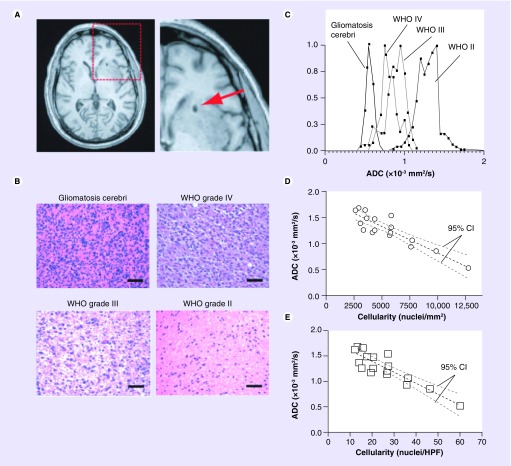
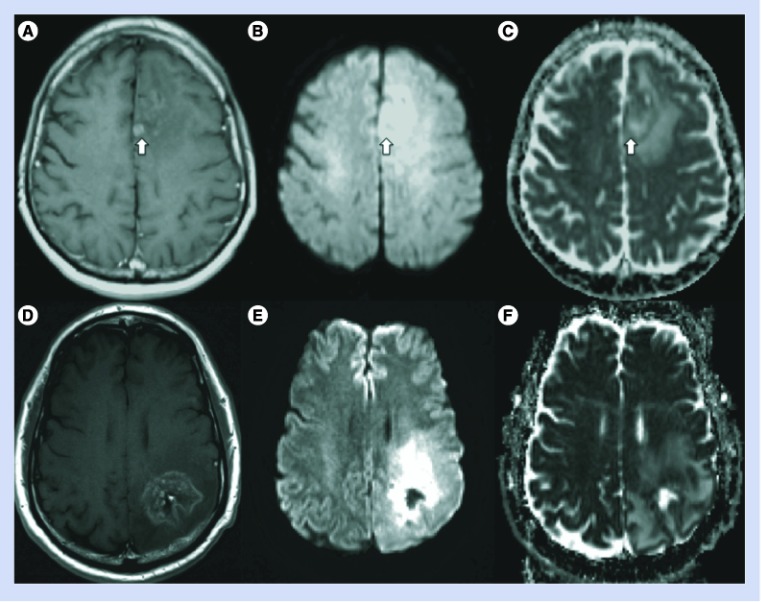
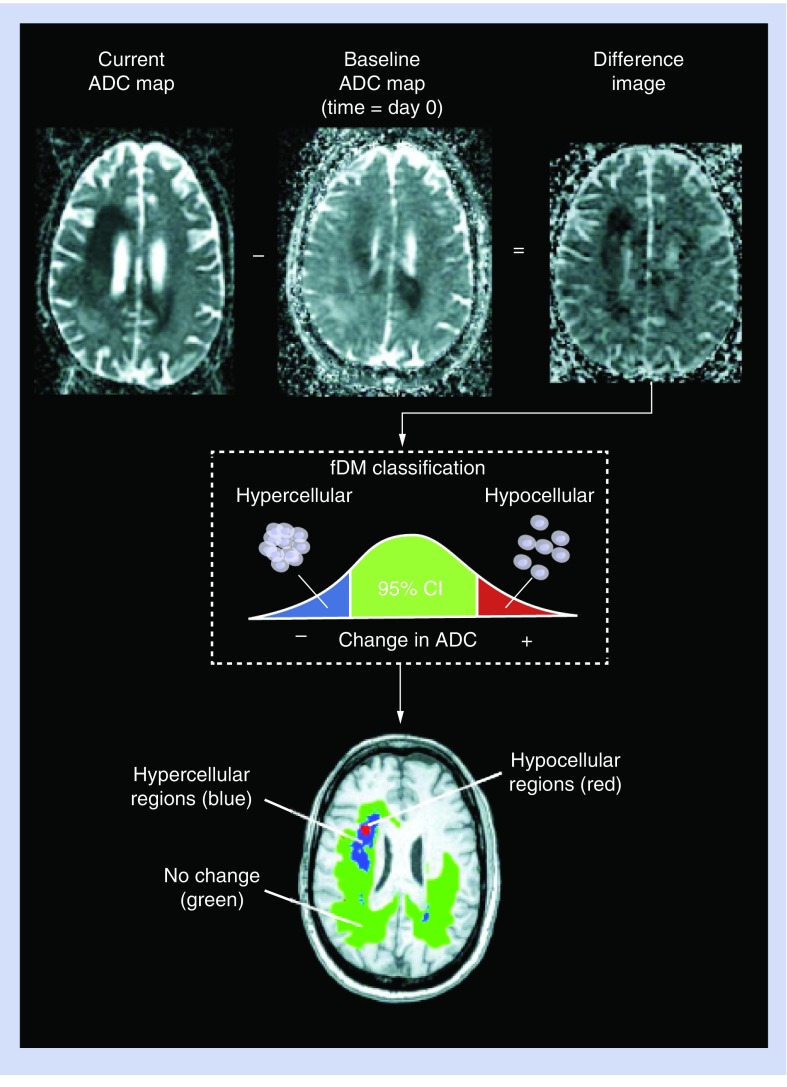
Diffusion-weighted imaging (DWI) is a powerful MRI method, which probes abnormalities of tissue structure by detecting microscopic changes in water mobility at a cellular level beyond what is available with other imaging techniques. Accordingly, DWI has the potential to identify pathology before gross anatomic changes are evident on standard anatomical brain images. These features of tissue characterization and earlier detection are what make DWI particularly appealing for the evaluation of gliomas and the newer therapies where standard anatomical imaging is proving insufficient. This article focuses on the basic principles and applications of DWI, and its derived parameter, the apparent diffusion coefficient, for the purposes of diagnosis and evaluation of glioma, especially in the context of monitoring response to therapy.


Conflict of interest statement

Financial & competing interests disclosure

Funding support was provided through NIH/NCI CA082500 and Advancing a Healthier Wisconsin Partnership Program. K Schmainda has ownership interest and spouse salary in Imaging Biometrics LLC. The author has no other relevant affiliations or financial involvement with any organization or entity with a financial interest in or financial conflict with the subject matter or materials discussed in the manuscript apart from those disclosed.

No writing assistance was utilized in the production of this manuscript.

Figures

Figure 1.
Figure 1.. A diffusion-weighted imaging sequence.
Typical timing of events that occur with a diffusion-weighted imaging sequence. They include application of r.f. pulses, consisting of 90° and 180° (inversion) pulses, and gs. The sequence of signals generated is also shown. Not shown are the imaging gradients, which are required for the measurement of spatially localized magnetic resonance signals. The diffusion weighting or b-value is defined by δ, G and Δ. δ: Diffusion gradient duration; Δ: Time between application of identical diffusion gradients; g: Diffusion gradient; G: Gradient amplitude; RF: Radiofrequency.
Figure 2.
Figure 2.. Correlation between spatially matched apparent diffusion coefficient measurements and cell density from stereotactic biopsy samples.
(A) Postoperative, high-resolution 3D T1-weighted anatomical MRI showing the biopsy location (arrow) in single patients. (B) Representative histological images (hematoxylin and eosin, ×20 magnification) showing how cell density increases with an increase in tumor grade (scale bars: 50 µm). (C) Spatially matched ADC measurements taken from the biopsy location in the same four patients as in (B), showing a decrease in ADC with an increase in tumor grade and cell density. (D) Scatter plot of average ADC within stereotactic biopsy locations and average cellularity for 17 patients (circles) shows a significant linear correlation (Pearson's correlation coefficient, r2 = 0.7933; p < 0.0001) between mean ADC and mean cell density in nuclei/mm2. (E) Correlation between mean ADC and mean cell density in nuclei/HPF. (D & E) Dashed black line indicates the linear regression while the dashed gray lines indicate the 95% CIs for the regression. ADC: Apparent diffusion coefficient; HPF: High power field. Reproduced with permission from John Wiley and Sons (License No. 2901470746078) [22].
Figure 3.
Figure 3.. Diffusion-weighted images and apparent diffusion coefficient images for low- and high-grade glioma.
(A & D) Postcontrast T1-weighted images, (B & E) diffusion-weighted images obtained at b = 1000 s/mm2 and (C & F) the corresponding apparent diffusion coefficient maps for patients with (A–C) grade II astrocytoma and (D–F) recurrent glioblastoma, respectively. The bright signal on diffusion-weighted images can result from some combination of restricted diffusion and T2 hyperintensity, the latter of which can occur within edematous tissue, for example. The apparent diffusion coefficient maps eliminate T2 contributions so that restricted diffusion, shown as areas of darker image intensity, can be more clearly delineated. In turn, restricted diffusion may represent areas of increased tumor cell density.
Figure 4.
Figure 4.. Calculation of functional diffusion maps from sequential apparent diffusion coefficient maps.
For each postbaseline time point, the baseline ADC map is subtracted from the ADC map from the current day. Each voxel within an ADC difference image is stratified into three categories based on the magnitude of the ADC change: a decrease in ADC suggestive of increased cellularity (blue voxels); an increase in ADC suggestive of decreased cellularity (red voxels); and those with no significant change in ADC (green voxels). ADC: Apparent diffusion coeffcient; fDM: Functional diffusion map. Reproduced with permission from John Wiley and Sons [22].
Figure 5.
Figure 5.. Example of voxel-wide analysis of diffusion changes within the contrast-enhancing tumor region of interest for a 55-year-old male patient, with a diagnosis of anaplastic oligoastrocytoma, after completing radiation therapy.
(A) A postcontrast image, (B) the colorized ADC threshold map (i.e., functional diffusion map) and (C) a graph showing the ADC changes of all pixels within the enhancing region of interest, with red, green and blue voxels representing increases (>5.5E-4), no change and decreases in ADC (<-5.5E-4), respectively. ADC: Apparent diffusion coefficient.
Figure 6.
Figure 6.. Standard MRI and functional diffusion maps in a patient with progressive disease after treatment with bevacizumab.
A 47-year-old male with a history of glioblastoma multiforme completed radiotherapy with concurrent temozolomide, followed by adjuvant temozolomide. His tumor recurred radiographically just prior to baseline ADC maps. The patient was then changed to bevacizumab monotherapy, and initially contrast enhancement and FLAIR signal abnormality improved substantially. The patient declined neurologically over 4 months of bevacizumab treatment, despite a positive radiographic response on postcontrast T1W (top row) and FLAIR images (middle row). The patient expired 2 months from the last fDM time point (6 months after start of bevacizumab treatment). During bevacizumab treatment, fDMs showed a rapid increase in the volume of hypercellularity (blue voxels), indicative of failed treatment. ADC: Apparent diffusion coefficient; fDM: Functional diffusion map; FLAIR: Fluid-attenuated inversion recovery; T1W: T1 weighted. Reproduced with permission from Springer (License No 2898871275280) [43].
Figure 7.
Figure 7.. Changes in apparent diffusion coefficient predict progression in patient with suspected pseudoprogession.
Shown are postcontrast T1-weighted images (A–C), FLAIR images (D–F) and ADC changes (G–I) for a 52-year-old male patient diagnosed with a glioblastoma at 1 month (column 1), 7 months (column 2) and 9 months (column 3) post radiation therapy plus temozolomide. Based on standard imaging, pseudoprogression and radiation effect were presumed since enhancement appeared and then disappeared. Although true progression was not officially ruled out, radiology reports and discussions leaned more heavily towards a likely diagnosis of pseudoprogression and radiation effect. However, the ADC was progressively decreasing following radiotherapy, suggesting an increase in tumor cellularity, and thus true progression. The clinical course was consistent with true progression since the subject expired months following the scan shown in column 3. ADC: Apparent diffusion coefficient; fDM: Functional diffusion map; FLAIR: Fluid-attenuated inversion recovery.

References

    1. MacDonald DR, Cascino TL, Schold SC, Cairncross JG. Response criteria for Phase II studies of malignant glioma. J. Clin. Oncol. 1990;8:1277–1280. - PubMed
    1. Brandsma D, van den Bent MJ. Pseudoprogression and pseudoresponse in the treatment of gliomas. Curr. Opin Neurol. 2009;22:633–638. - PubMed
    1. MacDonald DR, Cascino TL, Schold SC, Calmcross JG. Response criteria for Phase II studies of supratentorial malignant glioma. J. Clin. Oncol. 1990;8(7):1277–1280. - PubMed
    1. Wen PY, MacDonald DR, Reardon DA, et al. Updated response assessment criteria for high-grade gliomas: response assessment in neuro-oncology working group. J. Clin. Oncol. 2010;28(11):1963–1972. - PubMed
    1. Henson JW, Ulmer S, Harris GJ. Brain tumor imaging in clinical trials. Am. J. Radiol. 2008;29:419–424. - PMC - PubMed
    2. ▪ Presents a nice overview of the current limitations with standard anatomical imaging methods for the assessment of treatment response.

Publication types