. 2013 Aug 12:14:546.
doi: 10.1186/1471-2164-14-546.

Transcriptome deep-sequencing and clustering of expressed isoforms from Favia corals

Affiliations

Transcriptome deep-sequencing and clustering of expressed isoforms from Favia corals

Shaadi F Pooyaei Mehr et al. BMC Genomics. .

Abstract

Background: Genomic and transcriptomic sequence data are essential tools for tackling ecological problems. Using an approach that combines next-generation sequencing, de novo transcriptome assembly, gene annotation and synthetic gene construction, we identify and cluster the protein families from Favia corals from the northern Red Sea.

Results: We obtained 80 million 75 bp paired-end cDNA reads from two Favia adult samples collected at 65 m (Fav1, Fav2) on the Illumina GA platform, and generated two de novo assemblies using ABySS and CAP3. After removing redundancy and filtering out low quality reads, our transcriptome datasets contained 58,268 (Fav1) and 62,469 (Fav2) contigs longer than 100 bp, with N50 values of 1,665 bp and 1,439 bp, respectively. Using the proteome of the sea anemone Nematostella vectensis as a reference, we were able to annotate almost 20% of each dataset using reciprocal homology searches. Homologous clustering of these annotated transcripts allowed us to divide them into 7,186 (Fav1) and 6,862 (Fav2) homologous transcript clusters (E-value ≤ 2e(-30)). Functional annotation categories were assigned to homologous clusters using the functional annotation of Nematostella vectensis. General annotation of the assembled transcripts was improved 1-3% using the Acropora digitifera proteome. In addition, we screened these transcript isoform clusters for fluorescent proteins (FPs) homologs and identified seven potential FP homologs in Fav1, and four in Fav2. These transcripts were validated as bona fide FP transcripts via robust fluorescence heterologous expression. Annotation of the assembled contigs revealed that 1.34% and 1.61% (in Fav1 and Fav2, respectively) of the total assembled contigs likely originated from the corals' algal symbiont, Symbiodinium spp.

Conclusions: Here we present a study to identify the homologous transcript isoform clusters from the transcriptome of Favia corals using a far-related reference proteome. Furthermore, the symbiont-derived transcripts were isolated from the datasets and their contribution quantified. This is the first annotated transcriptome of the genus Favia, a major increase in genomics resources available in this important family of corals.


Figures

Figure 1
Figure 1
White light and fluorescent macrophotography of scleractinian coral samples. Samples of Favia sp. were placed in a narrow photography tank against a thin plate glass front. Fluorescent macro images (13.1 megapixel; Nikon D300S) were produced in a dark room by covering the flash (Vivitar 185) with interference bandpass excitation filters (Semrock, Rochester, NY). Longpass and bandpass emission filters (Semrock) were attached to the front of the camera. A) White light image; B) ex. 450–500 nm; em. 514LP; C) ex. 500–550 nm, em. 555 LP.
Figure 2
Figure 2
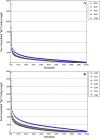
Contig length improvement after using CAP3. N50 (50% of the length of the assembled sequences) is a parameter to assess the contig length distribution (A)Fav1 contig length and N-values relationship. The thin lines represent the values for k-mer 35, 39, 45. The N50 length values were 1027, 1009, 949 bp, respectively. The line with cross represents the N-values after using CAP3, with N50 length of 1665. (B)Fav2 contig length and N-values relationship. The N50 length values for k-mer 39, 45, 49 were 453, 408, 391 bp, respectively. The N50 length values for k-mer 29, 31, 35 were 742, 734, 721 bp, respectively. The line with cross represents the N-values after using CAP3, with the N50 length of 1439 bp.
Figure 3
Figure 3
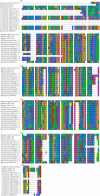
Overlapping region of amino acid sequence alignment of one exemplary cluster of identified homologous protein clusters. This gene family belongs to naturally expressed fluorescent protein. Conserved chromophore region (XYG) is located at the position 303–305. The newly identified sequences with extended N-terminal are s23Contig16657-5, s23Contig40465-7 in Fav1, s62Contig19888-6, and s62Contig41210-3 in Fav2. The full-length alignment is reported in Additional file 17: Figure S3.
Figure 4
Figure 4
Maximum likelihood tree of 46 known fluorescent proteins and 11 newly identified fluorescent protein sequences using RaxML. The alignment was 1,000 times bootstrapped and one FP sequence from N. vectensis was the out-group. The newly identified FP sequences are colored blue. Other colors represent different coral families; Faviidae, red; Acroporidae, orange; Oculinidae, brown; Pectiniidae, dark green; Meandrinidae, dark purple; Mussidae, pink; Poritidae, green; Node labels are bootstrap supports. See Additional file 19: File S14 for information on alignment.
Figure 5
Figure 5
Expression of an assembled contig in HEK293 mammalian cells yields fluorescence. An open reading frame of contig 19888 from Fav2 was synthesized using mammalian preferred codon usage (887 bases of s62Contig19888) and subcloned into pcDNA 3.1, and transfected into HEK293 mammalian cells using Fugene (Boehringer-Mannheim). The left panel depicts a phase contrast image of transfected HEK293 cells, and the right panel depicts fluorescence (using FITC excitation and emission) from the same field. Scale bar = 100 microns.
Figure 6
Figure 6
In silico coverage plot of the read-to-contig alignment measurements. The cDNA fragments with annotation for fluorescent protein coverage measurements.

References

    1. Metzker ML. Sequencing technologies—the next generation. Nat Rev Gen. 2009;11(1):31–46. - PubMed
    1. Koepke T, Schaeffer S, Krishnan V, Jiwan D, Harper A, Whiting M, Oraguzie N, Dhingra A. Rapid gene-based SNP and haplotype marker development in non-model eukaryotes using 3'UTR sequencing. BMC Genomics. 2012;13:18. doi: 10.1186/1471-2164-13-18. - DOI - PMC - PubMed
    1. Elmer KR, Fan S, Gunter HM, Jones JC, Boekhoff S, Kuraku S, Meyer A. Rapid evolution and selection inferred from the transcriptomes of sympatric crater lake cichlid fishes. Mole Ecol. 2010;19(Suppl 1):197–211. - PubMed
    1. Yang SS, Tu ZJ, Cheung F, Xu WW, Lamb JF, Jung HJ, Vance CP, Gronwald JW. Using RNA-Seq for gene identification, polymorphism detection and transcript profiling in two alfalfa genotypes with divergent cell wall composition in stems. BMC Genomics. 2011;12:199. doi: 10.1186/1471-2164-12-199. - DOI - PMC - PubMed
    1. Shi CY, Yang H, Wei CL, Yu O, Zhang ZZ, Jiang CJ, Sun J, Li YY, Chen Q, Xia T. et al.Deep sequencing of the Camellia sinensis transcriptome revealed candidate genes for major metabolic pathways of tea-specific compounds. BMC Genomics. 2011;12:131. doi: 10.1186/1471-2164-12-131. - DOI - PMC - PubMed

Publication types

LinkOut - more resources