

Mucosal and systemic T cell response in mice intragastrically infected with Neospora caninum tachyzoites
- PMID: 23937079
- PMCID: PMC3751650
- DOI: 10.1186/1297-9716-44-69
Mucosal and systemic T cell response in mice intragastrically infected with Neospora caninum tachyzoites
Abstract
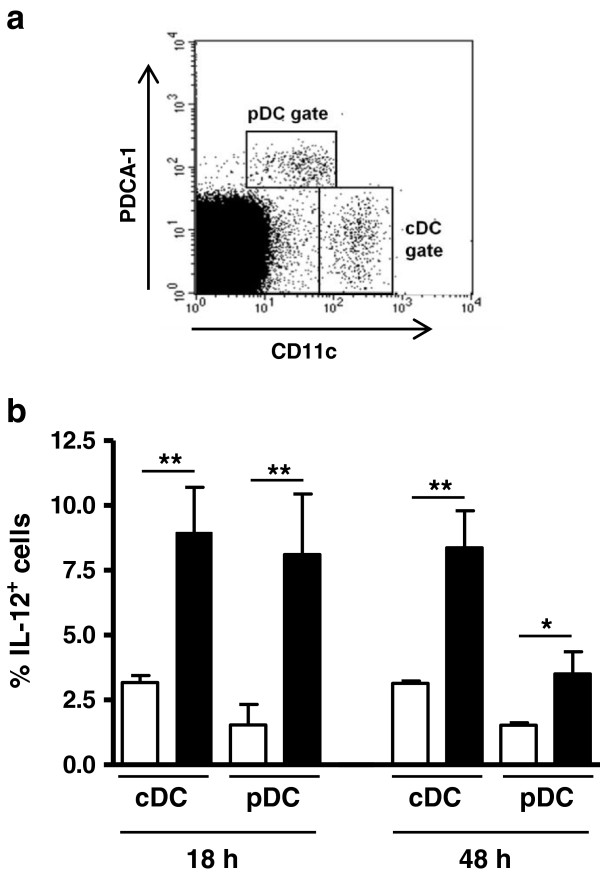
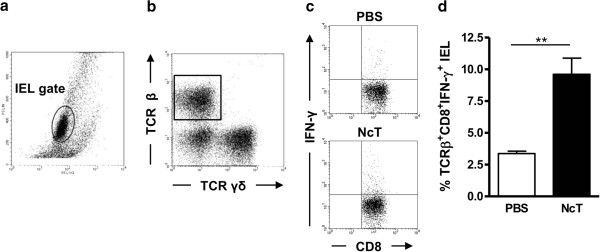
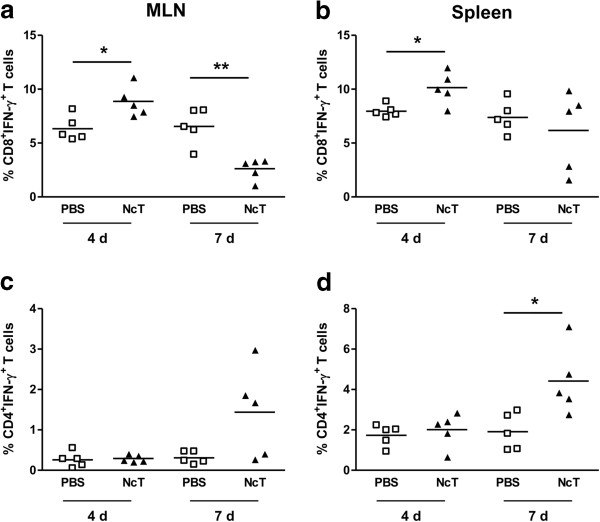
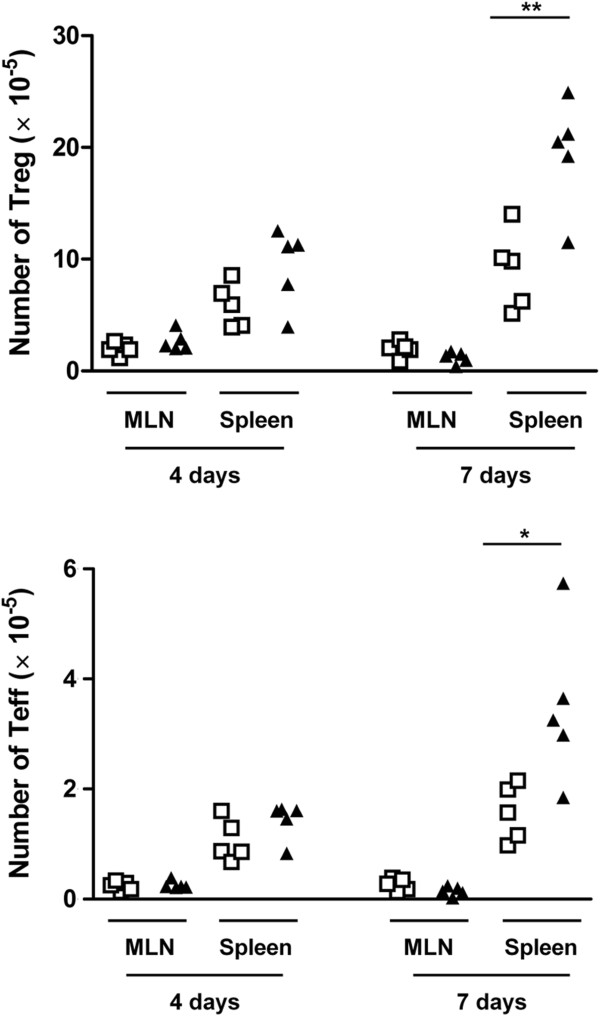
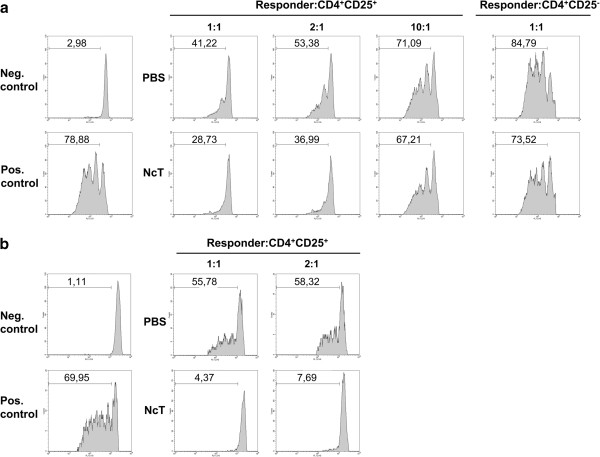
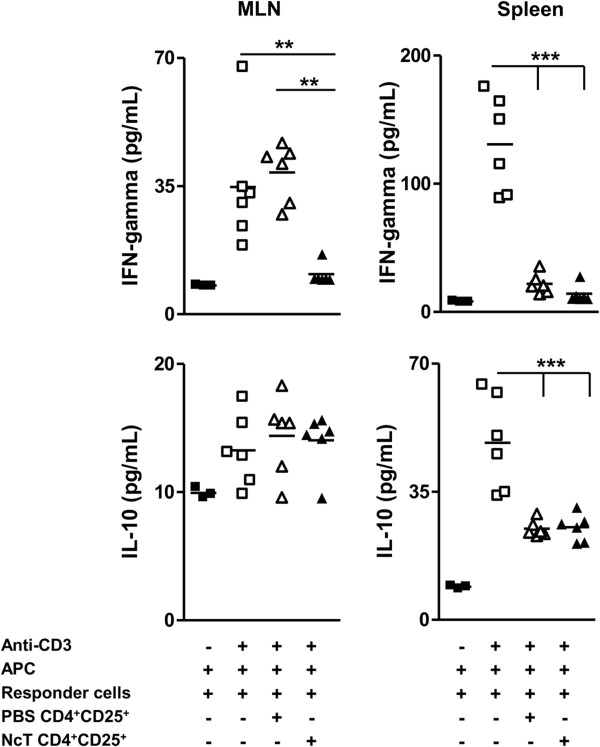
The murine model has been widely used to study the host immune response to Neospora caninum. However, in most studies, the intraperitoneal route was preferentially used to establish infection. Here, C57BL/6 mice were infected with N. caninum tachyzoites by the intragastric route, as it more closely resembles the natural route of infection through the gastrointestinal tract. The elicited T-cell mediated immune response was evaluated in the intestinal epithelium and mesenteric lymph nodes (MLN). Early upon the parasitic challenge, IL-12 production by conventional and plasmacytoid dendritic cells was increased in MLN. Accordingly, increased proportions and numbers of TCRαβ+CD8+IFN-γ+ lymphocytes were detected, not only in the intestinal epithelium and MLN, but also in the spleen of the infected mice. In this organ, IFN-γ-producing TCRαβ+CD4+ T cells were also found to increase in the infected mice, however later than CD8+ T cells. Interestingly, splenic and MLN CD4+CD25+ T cells sorted from infected mice presented a suppressive activity on in vitro T cell proliferation and cytokine production above that of control counterparts. These results altogether indicate that, by producing IFN-γ, TCRαβ+CD8+ cells contribute for local and systemic host protection in the earliest days upon infection established through the gastrointestinal tract. Nevertheless, they also provide substantial evidence for a parasite-driven reinforcement of T regulatory cell function which may contribute for parasite persistence in the host and might represent an additional barrier to overcome towards effective vaccination.
Figures
Similar articles
-
Predominant role of interferon-γ in the host protective effect of CD8(+) T cells against Neospora caninum infection.Sci Rep. 2015 Oct 9;5:14913. doi: 10.1038/srep14913. Sci Rep. 2015. PMID: 26449650 Free PMC article.
-
Analysis of the immune response to Neospora caninum in a model of intragastric infection in mice.Parasite Immunol. 2007 Jan;29(1):23-36. doi: 10.1111/j.1365-3024.2006.00911.x. Parasite Immunol. 2007. PMID: 17187652
-
Characterization of the B-cell immune response elicited in BALB/c mice challenged with Neospora caninum tachyzoites.Immunology. 2005 Sep;116(1):38-52. doi: 10.1111/j.1365-2567.2005.02195.x. Immunology. 2005. PMID: 16108816 Free PMC article.
-
Cellular and immunological basis of the host-parasite relationship during infection with Neospora caninum.Parasitology. 2006 Sep;133(Pt 3):261-78. doi: 10.1017/S0031182006000485. Epub 2006 Jun 6. Parasitology. 2006. PMID: 16753081 Review.
-
The antigenic composition of Neospora caninum.Int J Parasitol. 1999 Aug;29(8):1175-88. doi: 10.1016/s0020-7519(99)00085-5. Int J Parasitol. 1999. PMID: 10576569 Review.
Cited by
-
From Signaling Pathways to Distinct Immune Responses: Key Factors for Establishing or Combating Neospora caninum Infection in Different Susceptible Hosts.Pathogens. 2020 May 16;9(5):384. doi: 10.3390/pathogens9050384. Pathogens. 2020. PMID: 32429367 Free PMC article. Review.
-
Enrichment of IFN-γ producing cells in different murine adipose tissue depots upon infection with an apicomplexan parasite.Sci Rep. 2016 Mar 22;6:23475. doi: 10.1038/srep23475. Sci Rep. 2016. PMID: 27001522 Free PMC article.
-
Protective effect of intranasal immunization with Neospora caninum membrane antigens against murine neosporosis established through the gastrointestinal tract.Immunology. 2014 Feb;141(2):256-67. doi: 10.1111/imm.12191. Immunology. 2014. PMID: 24128071 Free PMC article.
-
Unraveling the role of shrimp hydrolysate as a food supplement in the immune function and fecal microbiota of beagle dogs.Sci Rep. 2025 Jul 15;15(1):25510. doi: 10.1038/s41598-025-09942-8. Sci Rep. 2025. PMID: 40665094 Free PMC article.
-
Immune response in the adipose tissue of lean mice infected with the protozoan parasite Neospora caninum.Immunology. 2015 Jun;145(2):242-57. doi: 10.1111/imm.12440. Immunology. 2015. PMID: 25581844 Free PMC article.
References
Publication types
MeSH terms
Substances
LinkOut - more resources
Full Text Sources
Other Literature Sources
Molecular Biology Databases
Research Materials
