. 2013 Sep;27(5):595-607.
doi: 10.1037/a0033354. Epub 2013 Aug 12.

Brain white matter tract integrity and cognitive abilities in community-dwelling older people: the Lothian Birth Cohort, 1936

Affiliations

Brain white matter tract integrity and cognitive abilities in community-dwelling older people: the Lothian Birth Cohort, 1936

Tom Booth et al. Neuropsychology. 2013 Sep.

Erratum in

  • Neuropsychology. 2013 Nov;27(6):701

Abstract

Objective: The present study investigates associations between brain white matter tract integrity and cognitive abilities in community-dwelling older people (N = 655). We explored two potential confounds of white matter tract-cognition associations in later life: (a) whether the associations between tracts and specific cognitive abilities are accounted for by general cognitive ability (g); and (b) how the presence of atrophy and white matter lesions affect these associations.

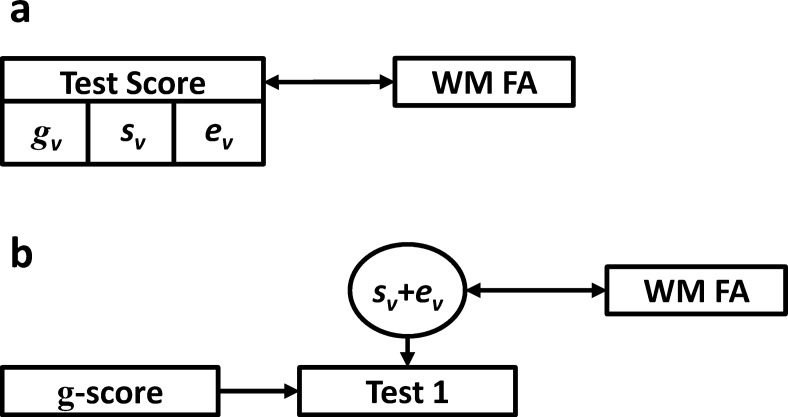
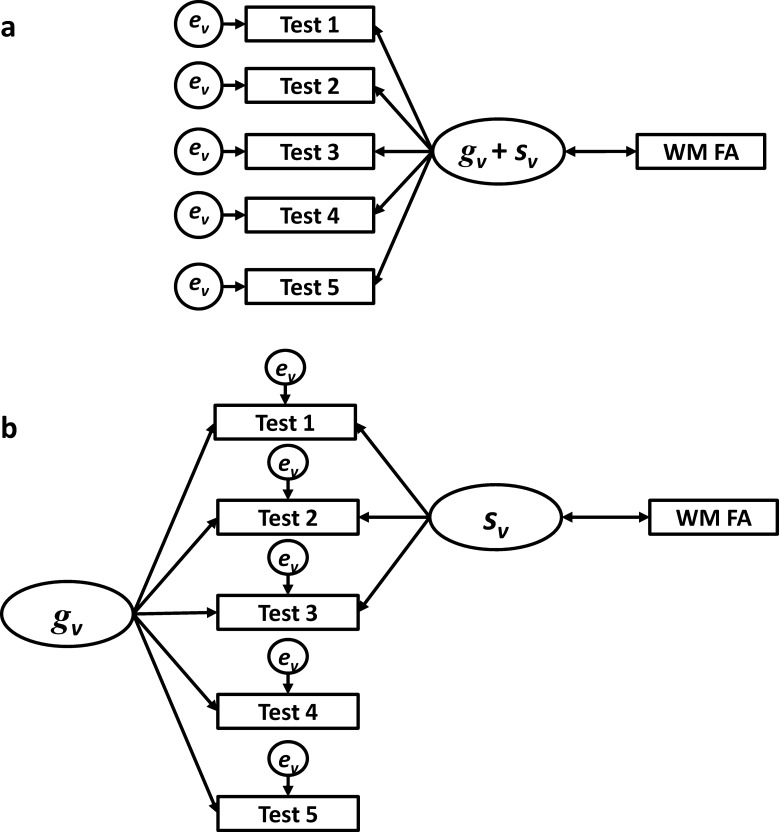
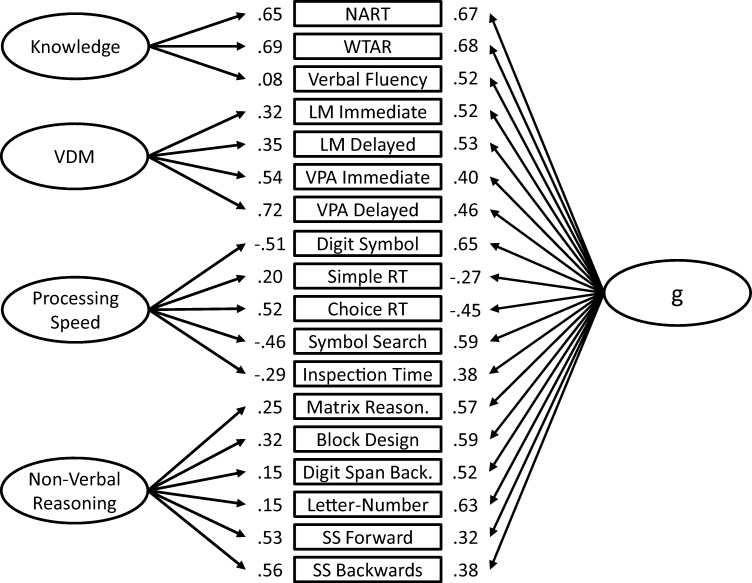
Method: Tract integrity was determined using quantitative diffusion magnetic resonance imaging tractography (tract-averaged fractional anisotropy [FA]). Using confirmatory factor analysis, we compared first-order and bifactor models to investigate whether specific tract-ability associations were accounted for by g.

Results: Significant associations were found between g and FA in bilateral anterior thalamic radiations (r range: .16-.18, p < .01), uncinate (r range: .19-.26, p < .001), arcuate fasciculi (r range: .11-.12, p < .05), and the splenium of corpus callosum (r = .14, p < .01). After controlling for g within the bifactor model, some significant specific cognitive domain associations remained. Results also suggest that the primary effects of controlling for whole brain integrity were on g associations, not specific abilities.

Conclusion: Results suggest that g accounts for most of, but not all, the tract-cognition associations in the current data. When controlling for age-related overall brain structural changes, only minor attenuations of the tract-cognition associations were found, and these were primarily with g. In totality, the results highlight the importance of controlling for g when investigating associations between specific cognitive abilities and neuropsychology variables.


Figures

Figure 1
Figure 1
Diagrammatic representations of variance decomposition in two methods for estimating the association between cognitive ability and neuroimaging variables. A simple correlation between an individual cognitive test and sum score (a). Controlling for a total g or IQ score on a single test or sum score (b). Rectangles = observed variables; circles = latent or residual variables; single-headed arrows = direct paths; double-headed arrows = correlations; WM FA = white matter fractional anisotropy; gv = general cognitive ability variance; sv = specific cognitive ability variance; ev = error variance.
Figure 2
Figure 2
Diagrammatic representations of variance decomposition in two structural equation models for estimating the association between cognitive ability and neuroimaging variables. A first-order factor model (a). A bifactor model, including separate general and specific ability latent factors (b). Rectangles = observed variables; circles = latent or residual variables; single-headed arrows = direct paths; double-headed arrows = correlations; WM FA = white matter fractional anisotropy; gv = general cognitive ability variance; sv = specific cognitive ability variance; ev = error variance.
Figure 3
Figure 3
Measurement model for the first-order model. VDM = verbal declarative memory; NART = National Adult Reading Test; WTAR = Wechsler Test of Adult Reading; LM = Logical memory; VPA = Verbal paired associates; RT = reaction time; SS = Spatial span. Model Fit: χ2(126) = 417.99, p < .001; comparative fit index = 0.95; Tucker−Lewis index = 0.93; root mean square error of approximation = .059, 95% confidence interval [.053, .066]; standardized root mean square residual = 0.058.
Figure 4
Figure 4
Measurement model for the bifactor model. VDM = verbal declarative memory; NART = National Adult Reading Test; WTAR = Wechsler Test of Adult Reading; LM = Logical memory; VPA = Verbal paired associates; RT = reaction time; SS = Spatial span. Model Fit: χ2(114) = 315.68, p < .001; comparative fit index = 0.96; Tucker−Lewis index = 0.95; root mean square error of approximation = .052, 95% confidence interval [.045, .059]; standardized root mean square residual = 0.044.

References

    1. Anderton B. H. (2002). Ageing of the brain. Mechanisms of Ageing and Development, 123, 811–817. doi:10.1016/S0047-6374(01)00426-2 - DOI - PubMed
    1. Ashtari M. (2012). Anatomy and functional role of the inferior longitudinal fasciculus: A search that has just begun. Developmental Medicine & Child Neurology, 54, 6–7. doi:10.1111/j.1469-8749.2011.04122.x - DOI - PubMed
    1. Behrens T. E. J., Johansen-Berg H. J., Jbabdi S., Rushworth M. F. S., & Woolrich M. W. (2007). Probabilistic diffusion tractography with multiple fibre orientations: What can we gain? NeuroImage, 34, 144–155. doi:10.1016/j.neuroimage.2006.09.018 - DOI - PMC - PubMed
    1. Bollen K. A. (1989). Structural equations with latent variables. New York, NY: Wiley.
    1. Brunner M., Nagy G., & Wilhelm O. (2012). A tutorial on hierarchically structured constructs. Journal of Personality, 80, 796–846. doi:10.1111/j.1467-6494.2011.00749.x - DOI - PubMed