. 2013 Nov;76(3):530-44.
doi: 10.1111/tpj.12307. Epub 2013 Oct 8.

Resistance gene enrichment sequencing (RenSeq) enables reannotation of the NB-LRR gene family from sequenced plant genomes and rapid mapping of resistance loci in segregating populations

Affiliations
Free PMC article

Resistance gene enrichment sequencing (RenSeq) enables reannotation of the NB-LRR gene family from sequenced plant genomes and rapid mapping of resistance loci in segregating populations

Florian Jupe et al. Plant J. 2013 Nov.
Free PMC article

Abstract

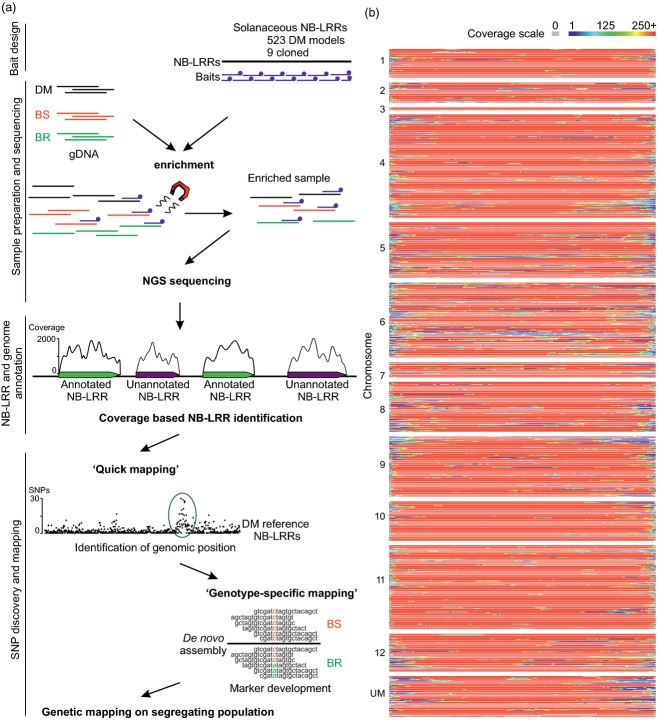
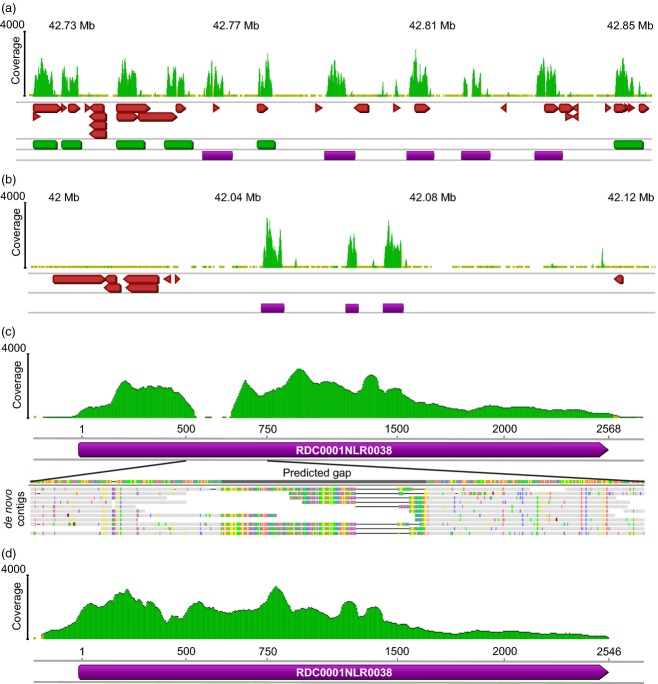
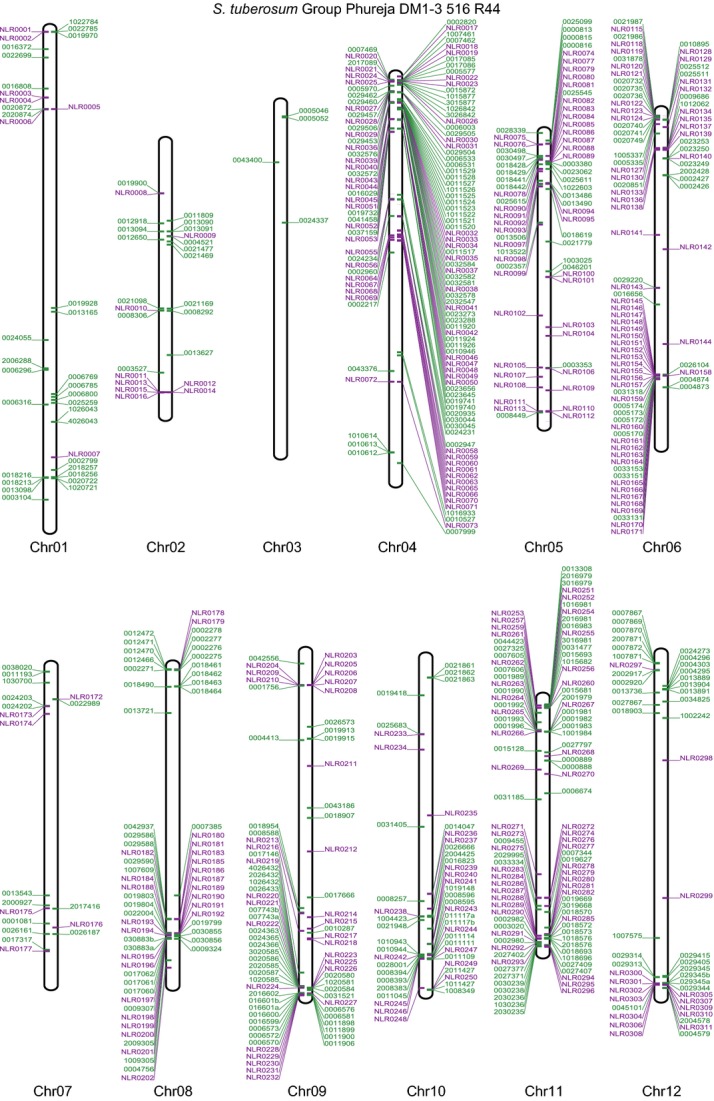
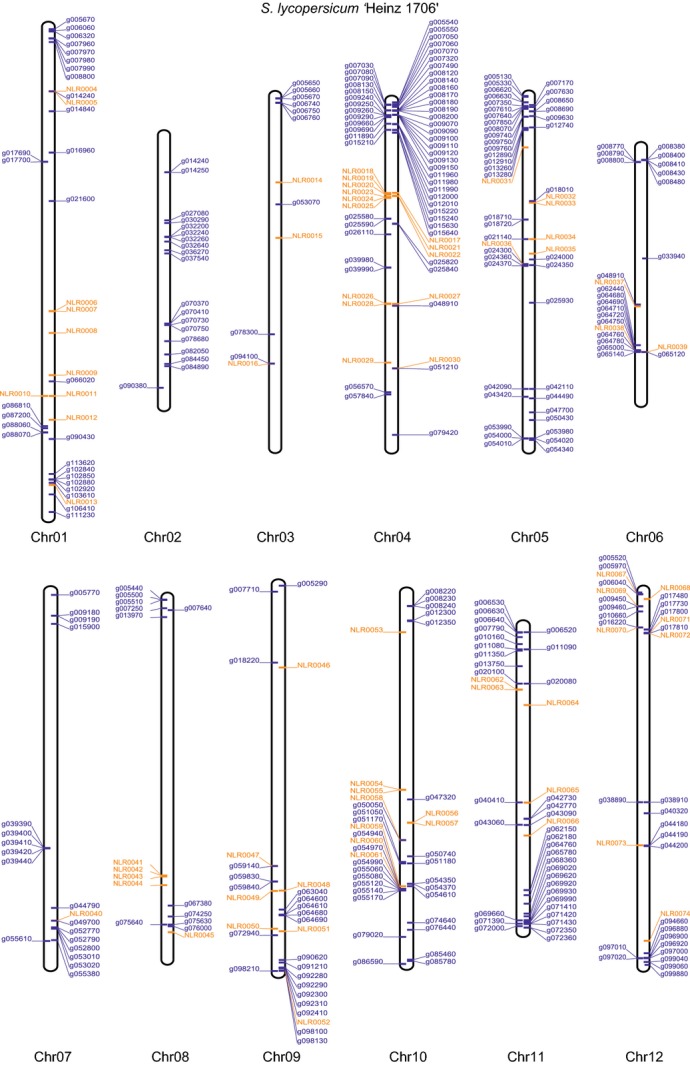
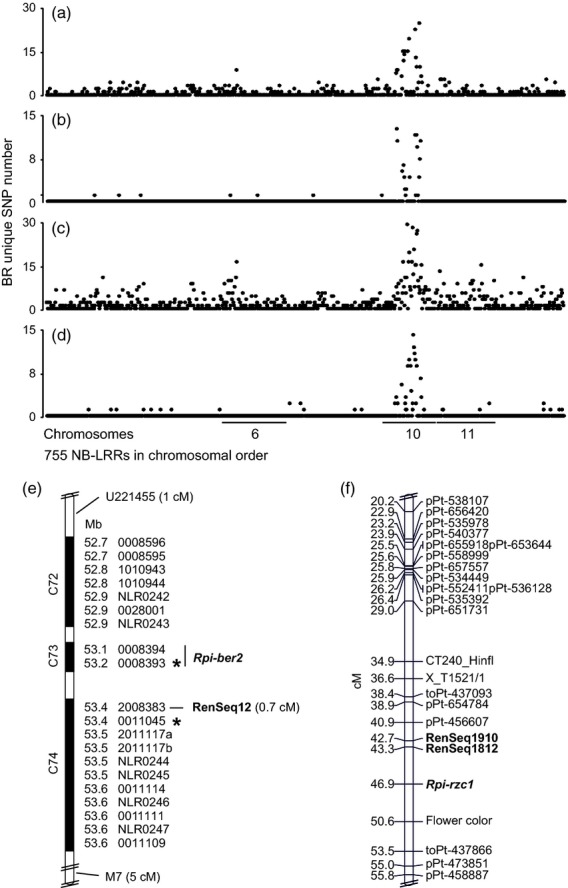
RenSeq is a NB-LRR (nucleotide binding-site leucine-rich repeat) gene-targeted, Resistance gene enrichment and sequencing method that enables discovery and annotation of pathogen resistance gene family members in plant genome sequences. We successfully applied RenSeq to the sequenced potato Solanum tuberosum clone DM, and increased the number of identified NB-LRRs from 438 to 755. The majority of these identified R gene loci reside in poorly or previously unannotated regions of the genome. Sequence and positional details on the 12 chromosomes have been established for 704 NB-LRRs and can be accessed through a genome browser that we provide. We compared these NB-LRR genes and the corresponding oligonucleotide baits with the highest sequence similarity and demonstrated that ~80% sequence identity is sufficient for enrichment. Analysis of the sequenced tomato S. lycopersicum 'Heinz 1706' extended the NB-LRR complement to 394 loci. We further describe a methodology that applies RenSeq to rapidly identify molecular markers that co-segregate with a pathogen resistance trait of interest. In two independent segregating populations involving the wild Solanum species S. berthaultii (Rpi-ber2) and S. ruiz-ceballosii (Rpi-rzc1), we were able to apply RenSeq successfully to identify markers that co-segregate with resistance towards the late blight pathogen Phytophthora infestans. These SNP identification workflows were designed as easy-to-adapt Galaxy pipelines.

Keywords: NB-LRR; Solanaceae; Solanum berthaultii; Solanum lycopersicum; Solanum ruiz-ceballosii; Solanum tuberosum Group Phureja clone DM1-3 516 R44; next-generation sequencing; pathogen resistance; target enrichment; technical advance.


Figures

Figure 1
Figure 1
Overview of the R gene enrichment (RenSeq) experiment. (a) Genomic DNA from the Solanum tuberosum Group Phureja clone DM1-3 516 R44 was enriched for NB-LRR sequence fragments using a customized NB-LRR RNA bait-library (Agilent SureSelect). Standard Illumina PE 76 bp sequencing and BWA mapping enabled the identification of 331 additional NB-LRR loci in DM. For rapid identification of markers segregating for pathogen resistance, bulked genomic DNA of the most resistant (BR) and most susceptible (BS) phenotyped plants of segregating populations were subjected to the same workflow. Illumina reads were then applied to a ‘quick mapping’ analysis to identify the approximate chromosomal position through mapping to the 755 predicted NB-LRRs from the Solanum tuberosum Group Phureja DM1-3 516R44 (this work) and plotting the number of BR unique SNPs per gene. A de novo assembly of NB-LRR enriched reads was used as genotype-specific reference to call BR unique SNPs. These were converted into markers and used to screen the segregating population. (b) A heat map was created to visualize the read coverage over the 755 reference NB-LRR loci. Illumina sequence information for the NB-LRR enriched DM sample was mapped against the 755 NB-LRR loci from this study with default BWA settings. Each line represents one locus that was normalized to a common length. Genes are in order as on the chromosomes. UM represents unmapped genes. Colors indicate coverage, from blue (lowest) to red (highest, over 250×).
Figure 2
Figure 2
Detailed analysis of two NB-LRR gene clusters and closing of an assembly gap using RenSeq reads. The stringent mapping of RenSeq reads to the potato chromosomes and unanchored superscaffolds identified genomic regions with NB-LRR sequences. The typical read coverage over these genes is shown with green peaks. Extraction of the underlying sequences and similarity analyses improved the previously described NB-LRR gene models (green boxes; Jupe et al., 2012), as well as aided the discovery of additional NB-LRR loci (purple boxes) from poorly annotated (a) or non-annotated (b) regions. General PGSC predicted DM gene models are depicted as red-boxed arrows. (a) We represent a close-up of the R3 resistance gene cluster C77, between positions 42.7Mb and 42.9Mb on chromosome 11. This analysis identified five yet uncharacterized NB-LRR loci. The identification of three NB-LRR loci from an unannotated region on chromosome 11 is depicted in (b). DM RenSeq reads and de novo assembled contigs were used to close gaps in the assembly of DM NB-LRRs. (c) shows the RenSeq coverage of RDC0001NLR0038 with stringently BWA mapped RenSeq reads (green peaks), and a detailed view of the alignment of de novo assembled contigs to the gap region. (d) The quality of the revised sequence is shown following stringent BWA mapping of RenSeq reads. Gene identifiers can be retrieved from Table S2. The figure is modified from the Geneious 5.6 genome browser view.
Figure 3
Figure 3
Physical mapping positions of NB-LRR loci on the 12 potato chromosomes. RenSeq of the sequenced potato clone DM as well as use of the latest potato chromosomal pseudomolecules enabled the positioning of 93% of the potato NB-LRR genes to the 12 chromosomes. The previously identified DM NB-LRR gene models (Jupe et al., 2012) are shown in green and those identified in this study are represented in purple. Genes to the left are on the forward strand, and to the right on the reverse strand.
Figure 4
Figure 4
Physical mapping positions of NB-LRR loci on the 12 tomato chromosomes. An empirically determined threshold of 80% sequence identity between bait and DNA fragments was used to screen for sequence stretches on the assembled tomato chromosomes with similarity to sequences in the bait library. This analysis identified 394 tomato NB-LRR loci, of which 387 could be positioned to the 12 chromosomes. The previously reported tomato NB-LRR loci (TGC 2012) are shown in blue and those identified in this study in orange. Genes to the left are on the forward strand, and to the right on the reverse strand.
Figure 5
Figure 5
‘Quick’ and ‘genotype-specific mapping’ analyses identify R gene candidate loci in S. berthaultii and S. ruiz-ceballosii. ‘Quick mapping’ (a,c) was carried out for NB-LRR enriched Illumina reads of BS and BR DNA of S. berthaultii and S. ruiz-ceballosii segregating populations to the 755 DM NB-LRR loci followed by SNP calling. The number of SNPs is plotted over the 755 NB-LRR sequences in chromosomal order. A high peak above chromosome 10 represents an enrichment of BR specific sequence variations that was used to identify the approximate candidate NB-LRR loci. Subsequent de novo assembly and ‘genotype-specific mapping’ to the resulting contigs (b,d) further reduced the background of SNPs and allowed a more specific resolution of variations that are unique to the BR individuals. These variations were further used to create genetic markers that were used to analyze the segregating populations. Genotyping the populations resulted in a physical linkage map (e) for the Rpi-ber2 population with closely linked markers derived from NB-LRR homologues within clusters C73 and C74 (Table S2). RenSeq12 depicts the closest marker linked to resistance, which was identified in this study. U221455 and M7 depict the closest markers that were previously identified using standard mapping methods (Rauscher et al., , WV). Physical positions of NB-LRR genes are given in Mb, and are based on the reference DM genome (Table S2). Asterisks represent the position of additional Sanger confirmed but not genetically mapped markers. A genetic linkage map (f) of the S. ruiz-ceballosii chromosome 10 shows the location of the late blight resistance gene (Rpi-rzc1), and two groups of close RenSeq markers represented by RenSeq1910 and RenSeq 1812. Cumulative genetic distances are shown in cM.

References

    1. Albert TJ, Molla MN, Muzny DM, et al. Direct selection of human genomic loci by microarray hybridization. Nat. Methods. 2007;4(11):903–905. - PubMed
    1. Altschul SF, Gish W, Miller W, Myers EW, Lipman DJ. Basic local alignment search tool. J. Mol. Biol. 1990;215(3):403–410. - PubMed
    1. Andolfo G, Sanseverino W, Rombauts S, Van de Peer Y, Bradeen JM, Carputo D, Frusciante L, Ercolano MR. Overview of tomato (Solanum lycopersicum) candidate pathogen recognition genes reveals important Solanum R locus dynamics. New Phytol. 2013;197(1):223–237. - PubMed
    1. Bailey TL, Elkan C. Fitting a mixture model by expectation maximization to discover motifs in biopolymers. Proc. Int. Conf. Intell. Syst. Mol. Biol. 1994;2:28–36. - PubMed
    1. Bakker E, Borm T, Prins P, et al. A genome-wide genetic map of NB-LRR disease resistance loci in potato. Theor. Appl. Genet. 2011;123(3):493–508. - PMC - PubMed

Publication types

MeSH terms