Starch biosynthesis in cassava: a genome-based pathway reconstruction and its exploitation in data integration
- PMID: 23938102
- PMCID: PMC3847483
- DOI: 10.1186/1752-0509-7-75
Starch biosynthesis in cassava: a genome-based pathway reconstruction and its exploitation in data integration
Abstract
Background: Cassava is a well-known starchy root crop utilized for food, feed and biofuel production. However, the comprehension underlying the process of starch production in cassava is not yet available.
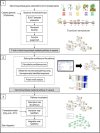
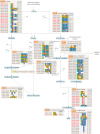
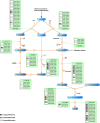
Results: In this work, we exploited the recently released genome information and utilized the post-genomic approaches to reconstruct the metabolic pathway of starch biosynthesis in cassava using multiple plant templates. The quality of pathway reconstruction was assured by the employed parsimonious reconstruction framework and the collective validation steps. Our reconstructed pathway is presented in the form of an informative map, which describes all important information of the pathway, and an interactive map, which facilitates the integration of omics data into the metabolic pathway. Additionally, to demonstrate the advantage of the reconstructed pathways beyond just the schematic presentation, the pathway could be used for incorporating the gene expression data obtained from various developmental stages of cassava roots. Our results exhibited the distinct activities of the starch biosynthesis pathway in different stages of root development at the transcriptional level whereby the activity of the pathway is higher toward the development of mature storage roots.
Conclusions: To expand its applications, the interactive map of the reconstructed starch biosynthesis pathway is available for download at the SBI group's website (http://sbi.pdti.kmutt.ac.th/?page_id=33). This work is considered a big step in the quantitative modeling pipeline aiming to investigate the dynamic regulation of starch biosynthesis in cassava roots.
Figures


Similar articles
-
Unlocking conserved and diverged metabolic characteristics in cassava carbon assimilation via comparative genomics approach.Sci Rep. 2018 Nov 9;8(1):16593. doi: 10.1038/s41598-018-34730-y. Sci Rep. 2018. PMID: 30413726 Free PMC article.
-
Cassava root membrane proteome reveals activities during storage root maturation.J Plant Res. 2016 Jan;129(1):51-65. doi: 10.1007/s10265-015-0761-4. Epub 2015 Nov 7. J Plant Res. 2016. PMID: 26547558
-
Predominantly symplastic phloem unloading of photosynthates maintains efficient starch accumulation in the cassava storage roots (Manihot esculenta Crantz).BMC Plant Biol. 2021 Jul 3;21(1):318. doi: 10.1186/s12870-021-03088-1. BMC Plant Biol. 2021. PMID: 34217217 Free PMC article.
-
The Cassava Source-Sink project: opportunities and challenges for crop improvement by metabolic engineering.Plant J. 2020 Aug;103(5):1655-1665. doi: 10.1111/tpj.14865. Epub 2020 Jun 26. Plant J. 2020. PMID: 32502321 Review.
-
Cassava biology and physiology.Plant Mol Biol. 2004 Nov;56(4):481-501. doi: 10.1007/s11103-005-2270-7. Plant Mol Biol. 2004. PMID: 15669146 Review.
Cited by
-
Unlocking conserved and diverged metabolic characteristics in cassava carbon assimilation via comparative genomics approach.Sci Rep. 2018 Nov 9;8(1):16593. doi: 10.1038/s41598-018-34730-y. Sci Rep. 2018. PMID: 30413726 Free PMC article.
-
Proteomics Profiling Reveals Carbohydrate Metabolic Enzymes and 14-3-3 Proteins Play Important Roles for Starch Accumulation during Cassava Root Tuberization.Sci Rep. 2016 Jan 21;6:19643. doi: 10.1038/srep19643. Sci Rep. 2016. PMID: 26791570 Free PMC article.
-
Profiling of transcriptional regulators associated with starch biosynthesis in sorghum (Sorghum bicolor L.).Front Plant Sci. 2022 Aug 30;13:999747. doi: 10.3389/fpls.2022.999747. eCollection 2022. Front Plant Sci. 2022. PMID: 36110358 Free PMC article.
-
Seasonal Variation in Transcriptomic Profiling of Tetrastigma hemsleyanum Fully Developed Tuberous Roots Enriches Candidate Genes in Essential Metabolic Pathways and Phytohormone Signaling.Front Plant Sci. 2021 Jul 9;12:659645. doi: 10.3389/fpls.2021.659645. eCollection 2021. Front Plant Sci. 2021. PMID: 34305963 Free PMC article.
-
Identification and expression analyses of new potential regulators of xylem development and cambium activity in cassava (Manihot esculenta).Planta. 2017 Mar;245(3):539-548. doi: 10.1007/s00425-016-2623-2. Epub 2016 Nov 29. Planta. 2017. PMID: 27900471
References
-
- Baguma Y. Regulation of starch synthesis in cassava. Uppsala: Swedish University of Agricultural Sciences; 2004. (PhD thesis).
-
- Ayling S, Ferguson M, Rounsley S, Kulakow P. Information resources for cassava research and breeding. Trop Plant Biol. 2012;5:140–151. doi: 10.1007/s12042-012-9093-x. - DOI
Publication types
MeSH terms
Substances
LinkOut - more resources
Full Text Sources
Other Literature Sources

