. 2013 Nov;231(3):388-99.
doi: 10.1002/path.4248.

MiR-26b is down-regulated in carcinoma-associated fibroblasts from ER-positive breast cancers leading to enhanced cell migration and invasion

Affiliations
Free PMC article

MiR-26b is down-regulated in carcinoma-associated fibroblasts from ER-positive breast cancers leading to enhanced cell migration and invasion

Eldo T Verghese et al. J Pathol. 2013 Nov.
Free PMC article

Abstract

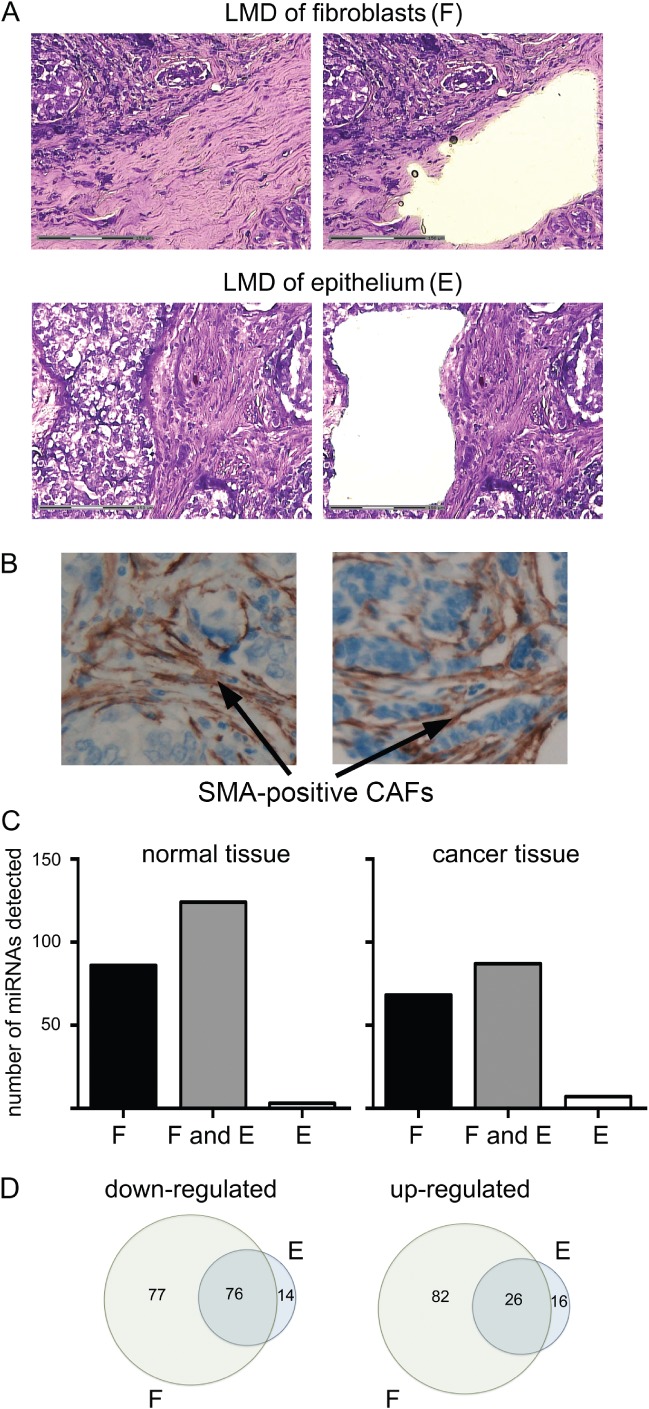
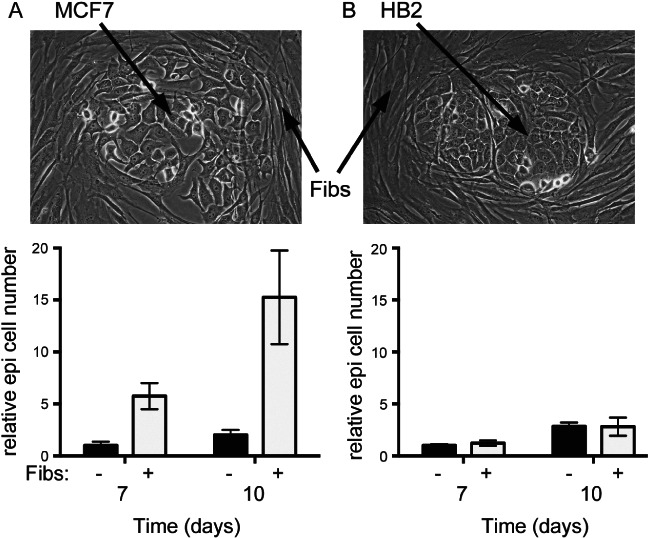
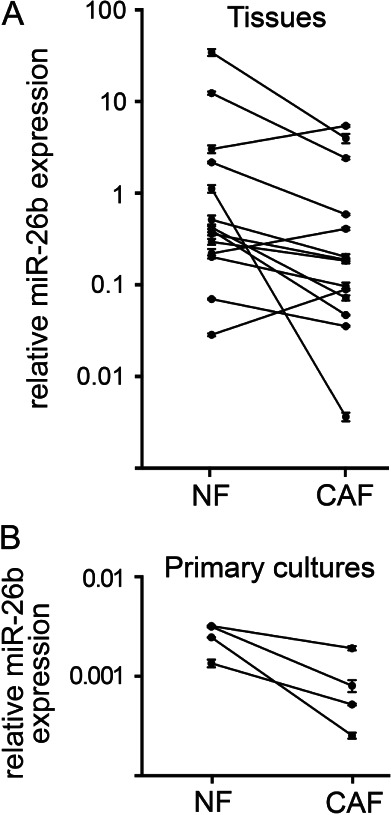
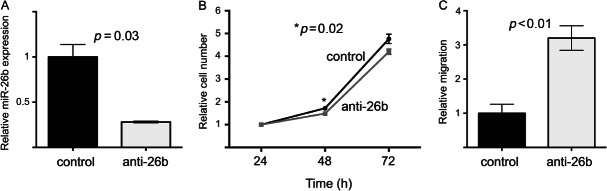
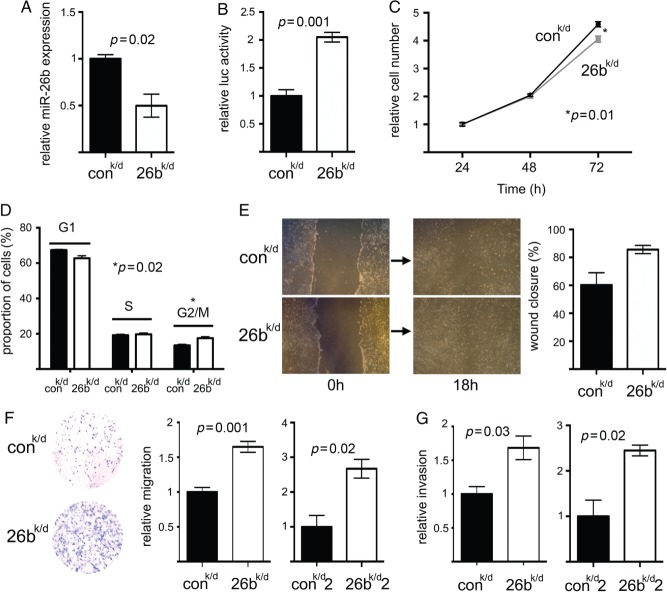
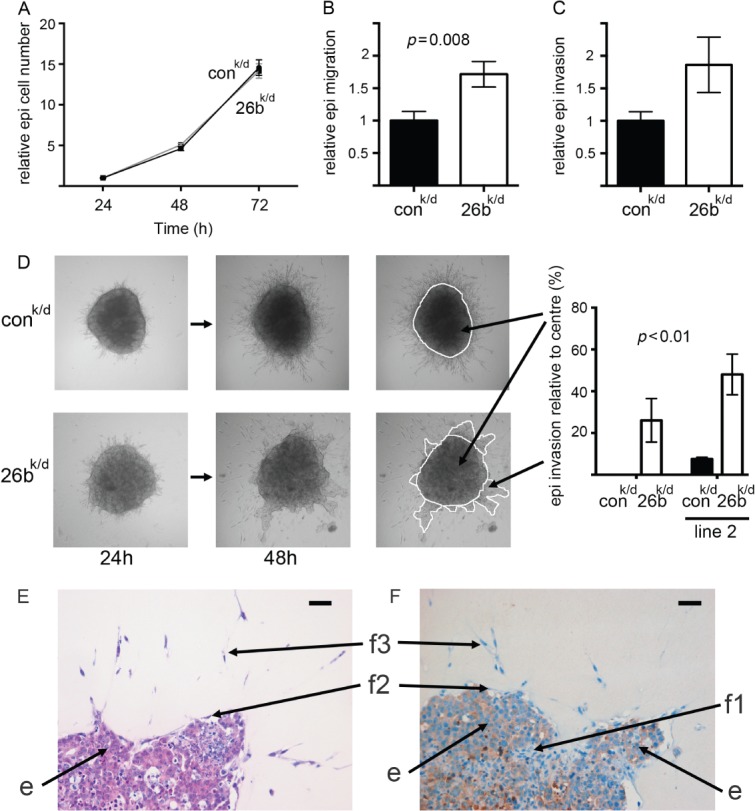
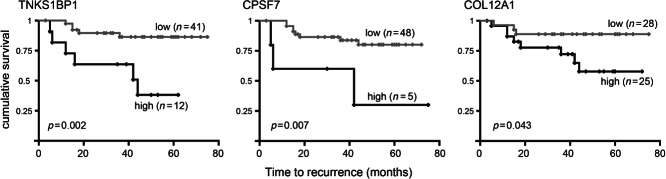
Carcinoma-associated fibroblasts (CAFs) influence the behaviour of cancer cells but the roles of microRNAs in this interaction are unknown. We report microRNAs that are differentially expressed between breast normal fibroblasts and CAFs of oestrogen receptor-positive cancers, and explore the influences of one of these, miR-26b, on breast cancer biology. We identified differentially expressed microRNAs by expression profiling of clinical samples and a tissue culture model: miR-26b was the most highly deregulated microRNA. Using qPCR, miR-26b was confirmed as down-regulated in fibroblasts from 15 of 18 further breast cancers. Next, we examined whether manipulation of miR-26b expression changed breast fibroblast behaviour. Reduced miR-26b expression caused fibroblast migration and invasion to increase by up to three-fold in scratch-closure and trans-well assays. Furthermore, in co-culture with MCF7 breast cancer epithelial cells, fibroblasts with reduced miR-26b expression enhanced both MCF7 migration in trans-well assays and MCF7 invasion from three-dimensional spheroids by up to five-fold. Mass spectrometry was used to identify expression changes associated with the reduction of miR-26b expression in fibroblasts. Pathway analyses of differentially expressed proteins revealed that glycolysis/TCA cycle and cytoskeletal regulation by Rho GTPases are downstream of miR-26b. In addition, three novel miR-26b targets were identified (TNKS1BP1, CPSF7, COL12A1) and the expression of each in cancer stroma was shown to be significantly associated with breast cancer recurrence. MiR-26b in breast CAFs is a potent regulator of cancer behaviour in oestrogen receptor-positive cancers, and we have identified key genes and molecular pathways that act downstream of miR-26b in CAFs.

Keywords: fibroblast; microRNA; microRNA-26b; stroma; tumour microenvironment.


Figures

Figure 1
Figure 1
Laser micro-dissection (LMD) allowed analysis of miRNA deregulation in the fibroblast and epithelial cell compartments of breast cancers. (A) Representative images of breast cancer tissue before (left) and after (right) LMD of fibroblast-enriched stroma or epithelial cells as labelled. FFPE breast tissue was sectioned and stained with toluidine blue. Regions for LMD were identified based on morphology. (B) Representative images of tumour sections stained for smooth muscle actin (SMA) using immunohistochemistry. (C, D) Total RNA was extracted from at least 5 mm2 of LMD tissue enriched for fibroblasts or epithelial cells from breast cancer tissue or from matched normal breast tissue. Microarray analyses of miRNA expression were performed. (C) Numbers of miRNAs detected in only samples of fibroblast-enriched stroma (F), in both samples of fibroblast-enriched stroma and epithelial cells (F and E), or in only epithelial cell samples (E) are shown for each tissue. (D) Relative expression of each miRNA was compared between normal and cancer tissue within fibroblast-enriched stroma (F) or within epithelial cells (E). Numbers of individual miRNAs that were up- or down-regulated in those compartments are displayed in Venn diagrams showing how many were deregulated in common between compartments (the intersects), or were deregulated in one compartment only.
Figure 2
Figure 2
Growth of MCF7 breast cancer epithelial cells, but not non-transformed ‘normal’ HB2 breast epithelial cells, was stimulated by immortalized breast fibroblasts. GFP-labelled MCF7 breast cancer cells (A) or HB2 benign breast epithelial cells (B) were co-cultured with immortalized breast fibroblasts (pictured), or were cultured alone, and epithelial cell growth was monitored by counting GFP-positive cells using flow cytometry for up to 10 days. Data are means of biological triplicates (± standard error) and are representative of duplicate experiments.
Figure 3
Figure 3
MiR-26b expression was frequently down-regulated in CAFs compared with matched NFs. (A) Samples enriched for fibroblasts were isolated by LMD from samples of matched breast cancer and normal tissue from 14 sequential cases of luminal A breast cancer (see Supplementary Table 1). (B) Primary cultures of matched NFs and CAFs were established from four further breast cancer cases. qPCR was used to analyse miR-26b expression relative to the geometric mean RNU6B and RNU48. Data are means of technical triplicates (± standard error).
Figure 4
Figure 4
Transient miR-26b down-regulation in breast fibroblasts inhibited growth but stimulated migration. Immortalized breast fibroblasts were transiently transfected with anti-miR-26b molecules or with control anti-miRs. (A) MiR-26b expression was quantified 24 h after transfection using qPCR (relative to RNU6B). Data are means of technical triplicates (± standard error) and are representative of duplicate experiments. (B) Cell growth was monitored by MTT assays over 72 h. (C) Migration of fibroblasts was assessed 24 h after transfection using trans-well migration assays by manual counting of cells that had passed through the membranes. Data in B and C are means of biological triplicates (± standard error) and are representative of duplicate experiments.
Figure 5
Figure 5
Stable down-regulation of miR-26b in breast fibroblasts inhibited growth but stimulated both migration and invasion. Immortalized breast fibroblasts were stably transduced to knock down miR-26b (26k/d) or with a control construct (conk/d). (A) MiR-26b expression was quantified in the two cell lines using qPCR (relative to RNU6B). Data are means of technical triplicates (± standard error) and are representative of duplicate experiments. (B) MiR-26b function was assessed as ratios of firefly to Renilla luciferase expression using a miR-26b target luciferase reporter (containing a perfect miR-26b binding site downstream of firefly luciferase and also coding for Renilla luciferase as an internal control). Cell lines were transfected with the reporter and dual luciferase assays were performed after 24 h. (C) Cell growth in the two cell lines was monitored using MTT assays over 72 h after initial seeding of equal numbers of cells. (D) Proportions of cells in G1, S, and G2/M phases of the cell cycle were determined in sub-confluent cultures using propidium iodide staining and flow cytometry. (E) Migration was determined in scratch-closure assays using digital imaging as the percentage scratch area remaining 18 h after scratch formation. Representative images are shown immediately after forming the scratch and at 18 h. (F) Migration was determined in trans-well assays by manual counting of cells that had passed through the membrane. A representative example of the trans-well migration result is shown. A second independent breast fibroblast line was also stably transduced (26k/d2 and conk/d2). Cells having migrated through the membranes were counted at 12 h for 26k/d and conk/d and at 24 h for 26k/d2 and conk/d2 (the second pair of transduced fibroblast lines migrated/invaded more slowly, reflecting variation between individual parental fibroblasts). (G) Invasion was assessed using trans-well assays by manual counting (at the same time points as F). Data in B–G are means of biological triplicates (± standard error) and are representative of duplicate (B, D–G) or triplicate (C) experiments.
Figure 6
Figure 6
MCF7 cell migration and invasion are stimulated by breast fibroblasts with reduced miR-26b. MCF7 cells (luciferase-positive) were co-cultured with miR-26b knock-down (26k/d) or with control (conk/d) breast fibroblasts (seeding ratio of one epithelial cell to three fibroblasts). (A) MCF7 cell growth was monitored within co-cultures using luciferase assays over 72 h (entire co-cultures were lysed and luciferase activity, present within the epithelial cells only, was quantified). (B, C) Migration or invasion of MCF7 cells within co-cultures was assessed 24 h after seeding in trans-well assays using luciferase assays (cells having passed through the membrane were lysed and luciferase activity was quantified within the lysates). (D) MCF7 cells and fibroblasts were aggregated, forming three-dimensional spheroids, and were suspended in a collagen-I/Matrigel matrix for up to 48 h. Invasion of MCF7 cells away from the central spheroid was quantified as shown at 48 h. Assays were performed with 26k/d or conk/d fibroblasts and with equivalent lines derived from an independent breast fibroblast line (line 2). (E, F) Spheroids were formalin-fixed and paraffin-embedded. Sections were taken and stained using haematoxylin and eosin (E) or for epithelial cytokeratins (F). Scale bars (top right of each image) = 100 µm. Epithelial cells (cobblestone morphology/cytokeratin-positive) are labelled ‘e’, while populations of fibroblasts (elongated morphology/cytokeratin-negative) are labelled ‘f1’ (internal to spheroid outgrowth), ‘f2’ (surface of outgrowth), and ‘f3’ (within matrix radiating from spheroid). Data are means of at least biological triplicates (± standard error) and are representative of duplicate (B–D) or triplicate (A) experiments.
Figure 7
Figure 7
Stromal expression of inferred miR-26b targets predicts breast cancer recurrence. Correlations between high and low (as defined using ROC analyses) stromal expression of TNKS1BP1, CPSF7 or COL12A1 and breast cancer recurrence were tested using Kaplan–Meier analyses, using publicly available mRNA expression array data from laser capture micro-dissected stromal breast cancer tissue from 53 breast cancers , mined using the Oncomine platform (https://www.oncomine.org).

References

    1. Ronnov-Jessen L, Petersen OW, Bissell MJ. Cellular changes involved in conversion of normal to malignant breast: importance of the stromal reaction. Physiol Rev. 1996;76:69–125. - PubMed
    1. Bhowmick NA, Neilson EG, Moses HL. Stromal fibroblasts in cancer initiation and progression. Nature. 2004;432:332–337. - PMC - PubMed
    1. Kojima Y, Acar A, Eaton EN, et al. Autocrine TGF-beta and stromal cell-derived factor-1 (SDF-1) signaling drives the evolution of tumor-promoting mammary stromal myofibroblasts. Proc Natl Acad Sci U S A. 2010;107:20009–20014. - PMC - PubMed
    1. Polyak K, Kalluri R. The role of the microenvironment in mammary gland development and cancer. Cold Spring Harbor Perspect Biol. 2010;2:a003244. - PMC - PubMed
    1. Finak G, Bertos N, Pepin F, et al. Stromal gene expression predicts clinical outcome in breast cancer. Nature Med. 2008;14:518–527. - PubMed

Publication types

MeSH terms