. 2013 Sep 27;288(39):27777-88.
doi: 10.1074/jbc.M113.466656. Epub 2013 Aug 12.

Cell survival during complete nutrient deprivation depends on lipid droplet-fueled β-oxidation of fatty acids

Affiliations

Cell survival during complete nutrient deprivation depends on lipid droplet-fueled β-oxidation of fatty acids

Ainara G Cabodevilla et al. J Biol Chem. .

Abstract

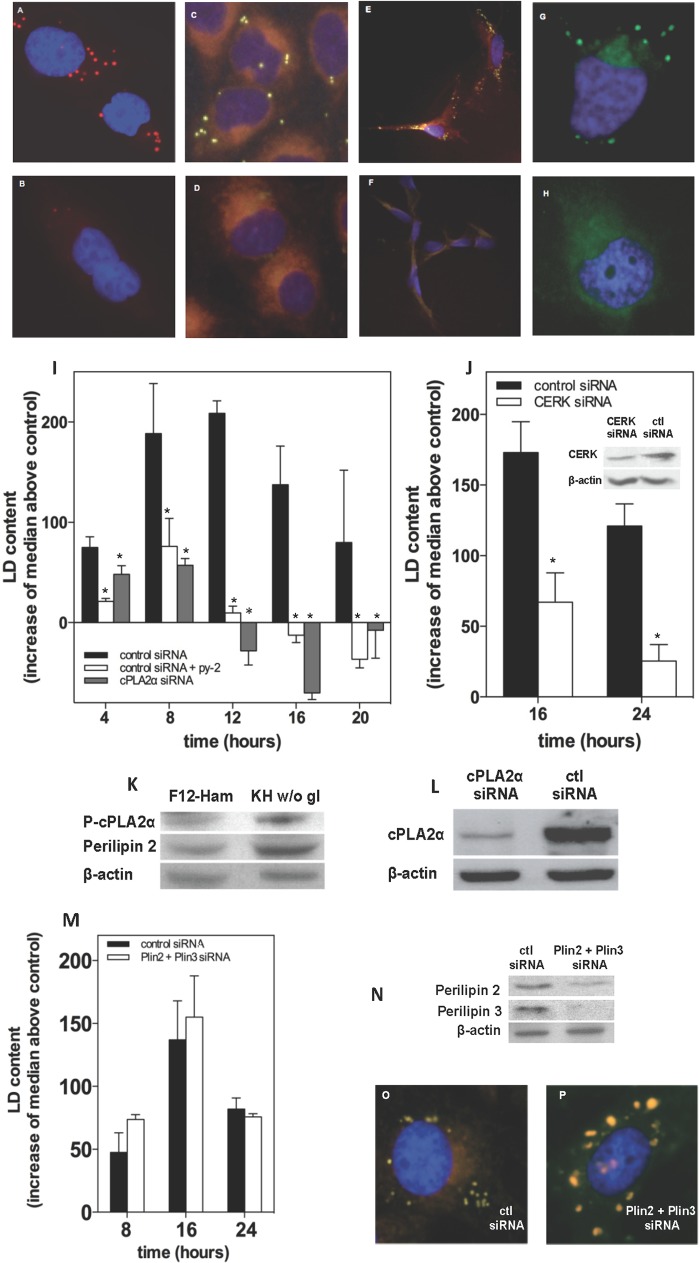
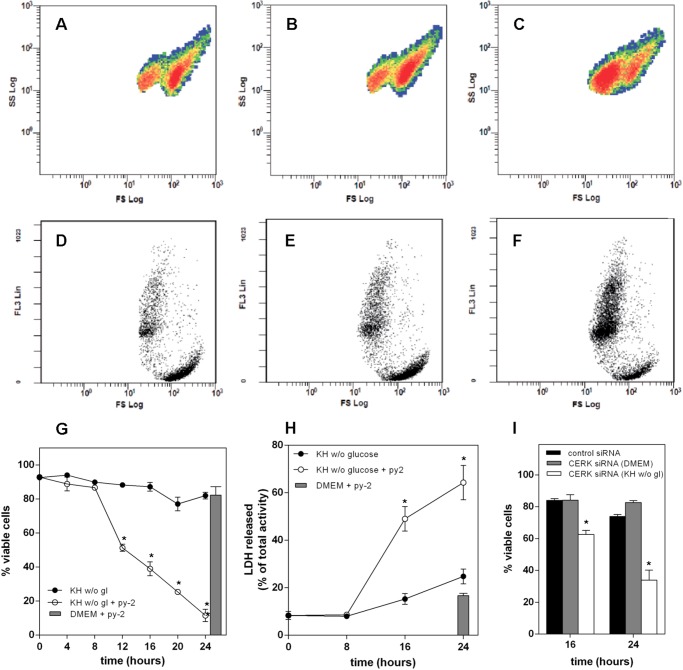
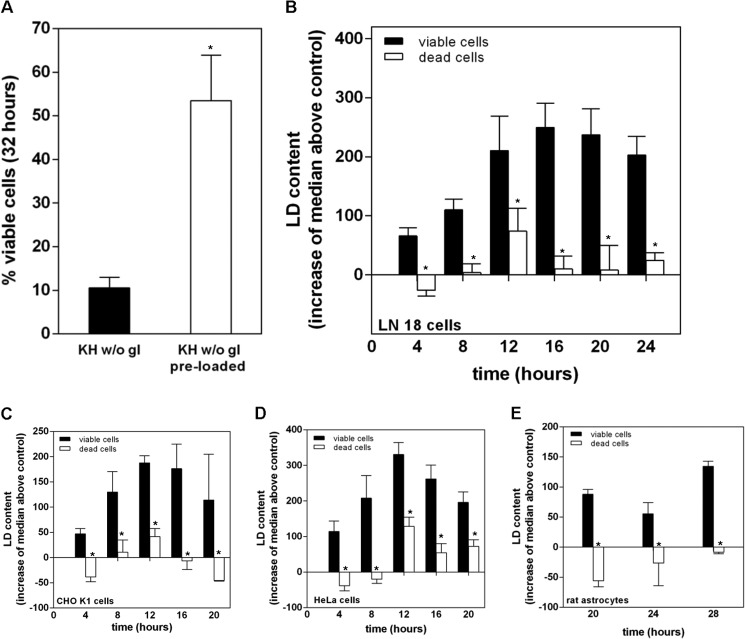
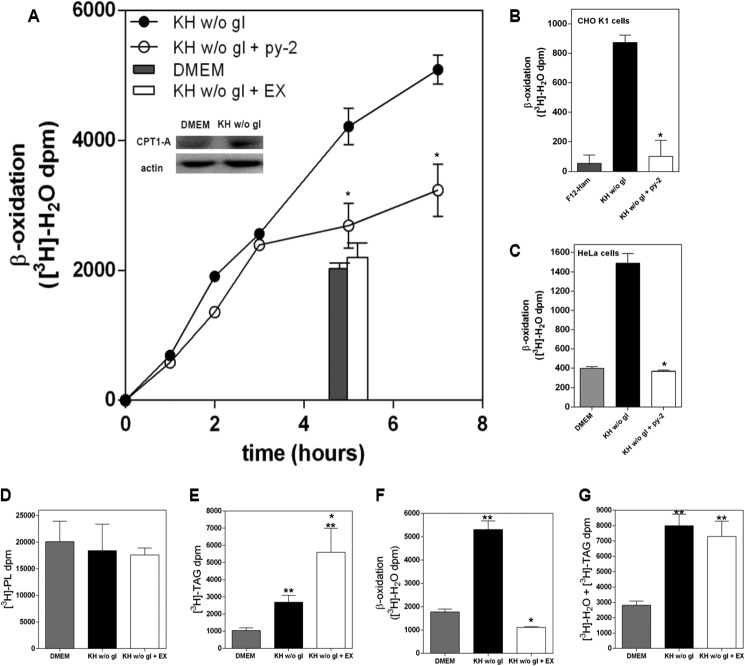
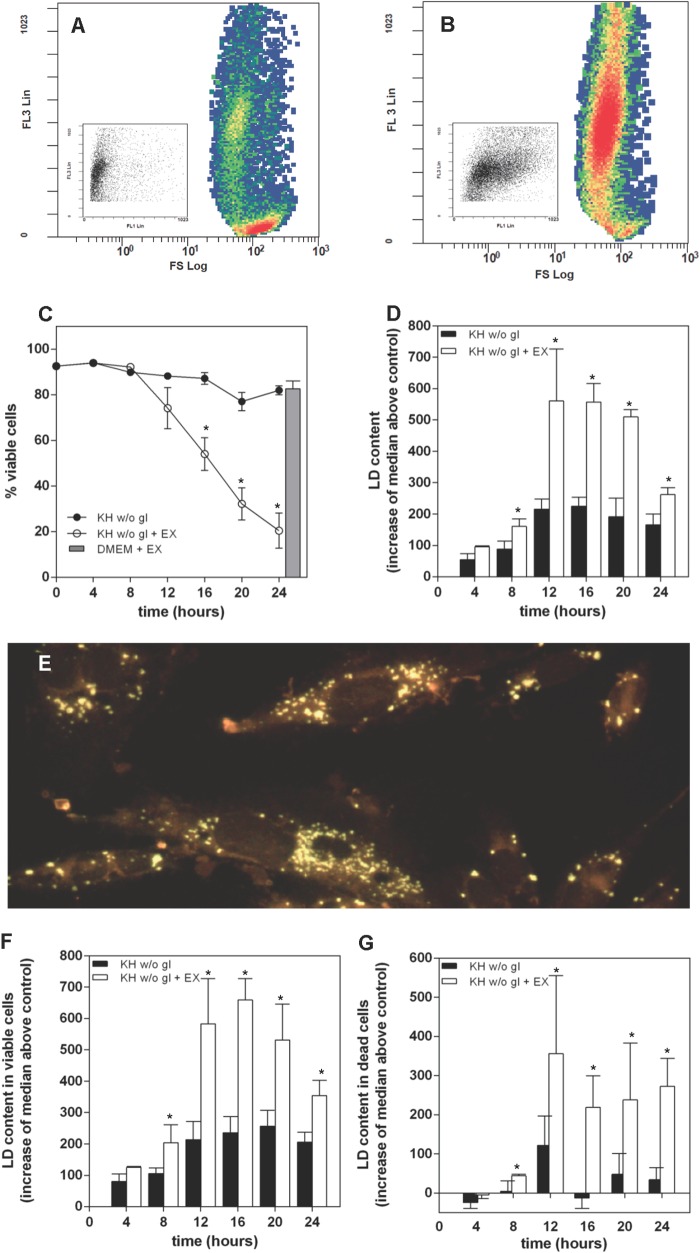
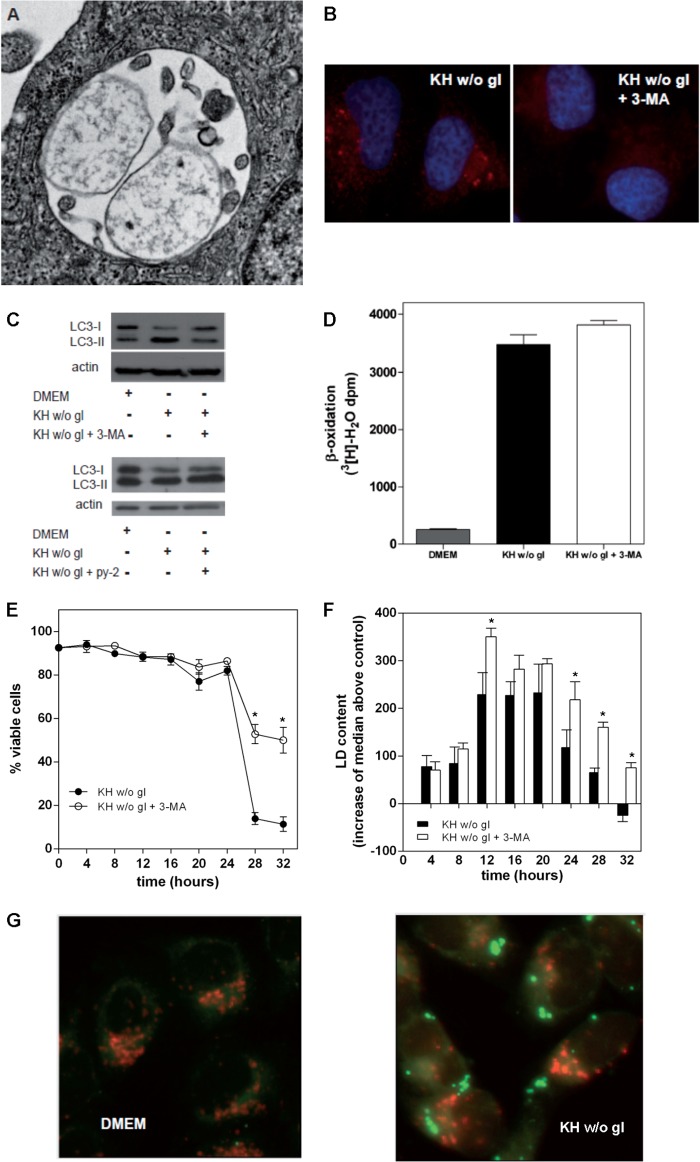
Cells exposed to stress of different origins synthesize triacylglycerols and generate lipid droplets (LD), but the physiological relevance of this response is uncertain. Using complete nutrient deprivation of cells in culture as a simple model of stress, we have addressed whether LD biogenesis has a protective role in cells committed to die. Complete nutrient deprivation induced the biogenesis of LD in human LN18 glioblastoma and HeLa cells and also in CHO and rat primary astrocytes. In all cell types, death was associated with LD depletion and was accelerated by blocking LD biogenesis after pharmacological inhibition of Group IVA phospholipase A2 (cPLA2α) or down-regulation of ceramide kinase. Nutrient deprivation also induced β-oxidation of fatty acids that was sensitive to cPLA2α inhibition, and cell survival in these conditions became strictly dependent on fatty acid catabolism. These results show that, during nutrient deprivation, cell viability is sustained by β-oxidation of fatty acids that requires biogenesis and mobilization of LD.

Keywords: Cell Death; Fatty Acid Oxidation; Lipid Droplet; Lipogenesis; Lipolysis; Starvation; Stress.


Figures

FIGURE 1.
FIGURE 1.
Cells maintained in Krebs buffer without glucose form LD in a process that requires cPLA2α. A–H, human LN18 glioblastoma (A and B), hamster CHO-K1 (C and D), rat astrocytes (E and F), and human HeLa cells (G and F) were kept in KH buffer without glucose for 16 h (A, B, E, and F) or 8 h (C, D, G, and H) and in the absence (top panels) or presence (bottom panels) of 1 μm py-2. LD were stained with Oil red O (A and B), Nile red (C–F), or BODIPY 493/503 (G and H). In all cases, treatment with KH without glucose triggered LD biogenesis, which was blocked by py-2. I, CHO cells were transfected with siRNA designed against cPLA2α (gray bars) or with a control siRNA (solid and open bars) and then kept in culture medium without serum for 24 h to deplete LD. Afterward, cells were switched to KH buffer without glucose in the absence (solid and gray bars) or presence of 1 μm py-2 (open bars), harvested at the times indicated, and stained with Nile red. The occurrence of LD was assessed by flow cytometry. Intensities in FL1 were quantified as the median values of the event distributions of each condition. Here, LD content is expressed as the increase of the median values above control (cells kept in FBS-free culture medium), and the results are means ± S.E. (error bars) of 3–5 independent experiments carried out with duplicate determinations. *, significantly different from KH without glucose. Cells maintained in KH buffer without glucose had increased expression of perilipin-2 and phosphorylation of cPLA2α at Ser505 (K). Inhibition of cPLA2α with the specific inhibitor py-2 blocked LD biogenesis (A–I), as did its down-regulation with siRNA (I and L). J, LN18 glioblastoma cells were transfected with siRNA designed against CERK (open bars) or with a control siRNA (solid bars) and switched to KH buffer without glucose after 24 h of FBS depletion. Flow cytometry quantification of LD content showed that down-regulation of CERK reduced LD occurrence. *, significantly different from control siRNA. M, LN18 cells were transfected with siRNA designed against perilipin 2 and perilipin 3 or with a control siRNA. Simultaneous knockdown of both proteins (N) had no effect on LD content as quantified by flow cytometry (M), although LD were bigger than those in control cells (O and P). The results are means ± S.E. of 3–5 independent experiments carried out with duplicate determinations.
FIGURE 2.
FIGURE 2.
py-2 induces death of nutrient-deprived cells. A–F, LN18 cells were kept for 16 h in DMEM (A and D) or KH without glucose in the absence (B and E) or presence of 1 μm py-2 (C and F), harvested, stained with PI, and analyzed by flow cytometry. A–C show the distribution of 10,000 events for each condition in terms of shape (SS) and size (FS). In all cases, events were distributed in two distinct populations, characterized by a different FS value. Cells kept in DMEM (A) and KH without glucose (B) appeared mostly in the population with a higher FS value, whereas those treated with KH without glucose + 1 μm py-2 (C) were in the low FS population. D–F show the distribution of the same samples in terms of viability, measured according to the ability of cells to exclude PI, which is expressed as FL3, and size (FS). In all cases, the high FS population excluded PI, as evidenced by the lower FL3 fluorescence. py-2 promoted an increase of the PI-stained population. G, LN18 cells were maintained in KH buffer without glucose in the absence (solid symbols) or presence (open symbols) of 1 μm py-2. At the indicated times, cells were harvested, and percentage viability was determined by flow cytometry. Gray bar, viability of cells in DMEM with 1 μm py-2 during 24 h. Inclusion of 1 μm py-2 accelerated the death of nutrient-deprived cells but was not toxic for cells in culture medium. Results are means ± S.E. (error bars) of six independent experiments carried out with duplicate determinations. H, similar results were obtained by determination of LDH activity released to the medium. Results are means ± S.E. of two independent experiments carried out with quadruplicate determinations. *, significantly different from KH buffer without glucose. I, down-regulation of CERK accelerated death of cells kept in KH buffer without glucose (open bars) as compared with control siRNA (solid bars) but had no effect on cells kept in DMEM (gray bars). Results are means ± S.E. of two independent experiments carried out with triplicate determinations. *, significantly different from control siRNA.
FIGURE 3.
FIGURE 3.
Cells surviving nutrient deprivation contain LD, whereas dead cells are devoid of them. A, LN18 cells were maintained overnight in FBS-free DMEM to ensure depletion of LD (filled bar) or DMEM supplemented with 10% FBS and 100 μm sodium oleate (open bar) prior to their treatment with KH without glucose for 32 h. Cells devoid of LD before starvation died faster than those that had been preloaded with LD. B–E, LN18 (B), CHO (C), HeLa (D), or astrocytes (E) were maintained in KH without glucose for the times indicated and then stained with Nile red, and LD content in viable (solid bars) and dead (open bars) cell populations was assessed by flow cytometry. Viable and dead cell populations in Nile red-stained samples were gated in SS/FS plots, and their LD content was determined after the median values of the FL1 event distributions. Results are expressed as FL1 median values above that of control samples devoid of LD, maintained overnight in culture medium without FBS, and are means ± S.E. (error bars) of five (B) or three (C–E) independent experiments carried out with duplicate determinations. *, significantly different from viable cells.
FIGURE 4.
FIGURE 4.
Nutrient deprivation induces β-oxidation that requires LD biogenesis. A, LN18 cells were prelabeled overnight with [3H]palmitate prior to their treatment with DMEM (gray bar) or KH without glucose in the absence (solid symbols) or presence of 1 μm py-2 (open symbols) or 30 μm EX (open bar). β-Oxidation was monitored after the generation of [3H]water. The inset shows increased expression of CPT1 after 16 h of starvation. B and C, [3H]palmitate-prelabeled CHO (B) or HeLa (C) cells were treated for 4 h with culture medium (gray bar) or KH without glucose in the absence (solid bar) or presence of 1 μm py-2 (open bar). β-Oxidation was defined as EX-sensitive production of [3H]water. Results are means ± S.E. (error bars) of an experiment carried out with determinations in quadruplicate and are representative of four (A) or three (B and C) independent experiments with similar outcome. *, significantly different from KH without glucose. D–G, [3H]palmitate-prelabeled LN18 cells were maintained in culture medium (gray bars) or KH without glucose in the absence (solid bars) or presence of 30 μm EX (open bars). After 8 h, lipids were extracted and separated by high performance thin layer chromatography, and radioactivity in phospholipids (PL) and TAG was quantified. D, nutrient deprivation did not induce a significant change in phospholipid content. E, nutrient deprivation induced TAG accumulation that was potentiated after inhibition of β-oxidation with EX. F, nutrient deprivation stimulated the generation of [3H]water as an index of β-oxidation, which was inhibited by EX. G, aggregated values of [3H]TAG + [3H]water, illustrating that nutrient deprivation induced a process of lipogenesis that led to the oxidation of fatty acids. Results are means ± S.E. of one experiment with quadruplicate determinations that was repeated once with a similar outcome. *, significantly different from KH without glucose; **, significantly different from DMEM.
FIGURE 5.
FIGURE 5.
Under nutrient deprivation, inhibition of β-oxidation accelerates cell death and leads to the accumulation of LD. A and B, HeLa cells were kept for 10 h in KH without glucose and in the absence (A) or presence of 30 μm EX (B). After treatment, they were harvested and stained with PI and BODIPY 493/503 to measure viability and LD content. A and B show the event distribution for each treatment in terms of PI permeability (FL3) and size (FS). Inhibition of β-oxidation (B) induced death of nutrient-deprived cells. Insets show the event distribution of the dead cell population for each treatment in terms of FL3 and LD occurrence (FL1). The increased FL1 signal induced by EX is apparent. C, inhibition of β-oxidation with 30 μm EX accelerated the death of LN18 cells maintained in KH without glucose but had no effect on cells maintained in culture medium (DMEM), as denoted by a gray bar. Treatment with EX led to an overall accumulation of LD (D) that was very apparent in Nile red-stained cells after a 16-h treatment (E). Analysis of viable (F) and dead cells (G) shows increased LD occurrence in EX-treated samples. Results are means ± S.E. (error bars) of six independent experiments carried out with duplicate determinations. *, significantly different from KH without glucose.
FIGURE 6.
FIGURE 6.
Inhibition of autophagy does not accelerate death of nutrient-deprived cells. Treatment with KH without glucose induced autophagy in LN18 cells. A, electronic microscope image of a late autophagosome after 16 h in KH without glucose. B and C, LN18 cells were treated for 8 h with DMEM or KH without glucose (w/o gl) and with or without 1 μm py-2 or the autophagy inhibitor 3-MA (10 mm). Nutrient deprivation induced autophagy, as monitored by the appearance of LC3 puncta (B, left) or by conversion of LC3-I to LC3-II (C). This process was blocked by 3-MA (B, right; C, top) but not by inhibition of LD biogenesis with py-2 (C, bottom). D, LN18 cells were prelabeled overnight with [3H]palmitate prior to their treatment for 5 h with DMEM or KH without glucose and with or without 3-MA or EX. Inhibition of autophagy with 3-MA had no effect on β-oxidation of fatty acids, which was defined as EX-sensitive production of [3H]water. E, at long treatment times, blocking autophagy had a significant cytoprotective effect. F, flow cytometry analysis of Nile red-stained cells showed an overall accumulation of LD in cells treated with 3-MA. G, LN18 cells were kept 16 h in DMEM (left) or KH without glucose (right); acidic compartments were labeled with LysoTracker® Red DND-99, and LD were stained with BODIPY 493/503. Results in D are means ± S.E. (error bars) of one experiment in quadruplicate that is representative of three experiments with similar results. Results in E and F are means ± S.E. of 4–6 independent experiments carried out with duplicate determinations, and asterisks in these panels denote significance as compared with KH without glucose.

References

    1. Murphy D. J. (2012) The dynamic roles of intracellular lipid droplets. From archaea to mammals. Protoplasma 249, 541–585 - PubMed
    1. Farese R. V., Jr., Walther T. C. (2009) Lipid droplets finally get a little R-E-S-P-E-C-T. Cell 139, 855–860 - PMC - PubMed
    1. Greenberg A. S., Coleman R. A. (2011) Expanding roles for lipid droplets. Trends Endocrinol. Metab. 22, 195–196 - PMC - PubMed
    1. Carman G. M. (2012) Thematic minireview series on the lipid droplet, a dynamic organelle of biomedical and commercial importance. J. Biol. Chem. 287, 2272. - PMC - PubMed
    1. Bozza P. T., Bakker-Abreu I., Navarro-Xavier R. A., Bandeira-Melo C. (2011) Lipid body function in eicosanoid synthesis. An update. Prostaglandins Leukot. Essent. Fatty Acids 85, 205–213 - PubMed

Publication types

MeSH terms

LinkOut - more resources